"I've known Andrew for a number of years. He knows cycles better than anybody I've ever met, and I've studied cycles all my life."
"Andrew Pancholi's Market Timing Report is consistently the most accurate cycles forecast there is for traders of major markets."
"I find The Market Timing Report to be very valuable. It's just what I need to mix with my own work to help prove a great trade awaits.
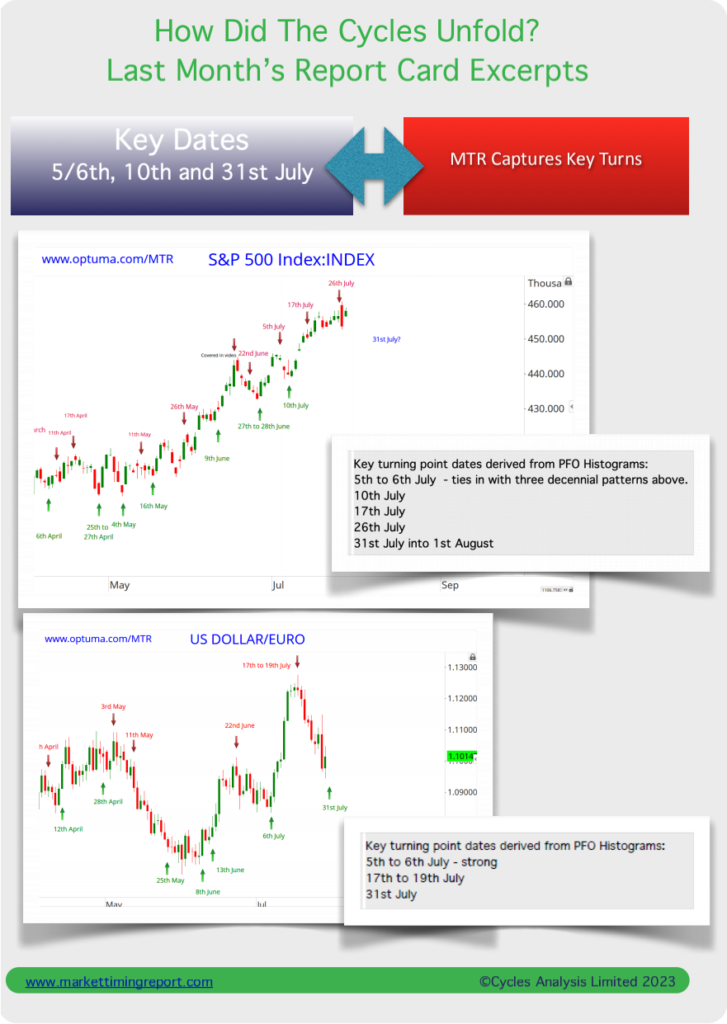
This work is astonishingly accurate, like the S&P 500 on the 18th August and the bounce on the 26th August, those two calls are just two of many in the reports. Brilliant stuff.
I have known Andy since the reports first started out and can tell you that he is a genuine guy and puts a lot of work into these reports. He understands that the report should work for you to maximize your account profits. That's the key for me!
There is also a nice summary of the timing point dates for ease of access and much more.
I'm very happy with the report and recommend them thoroughly."
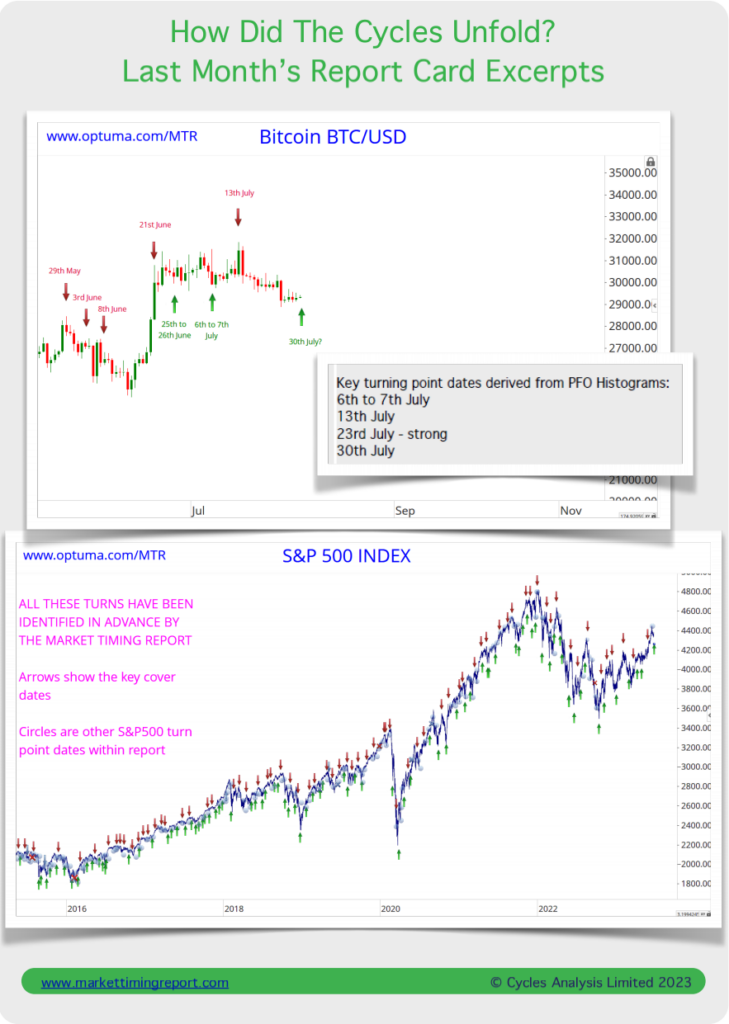

"Andrew, just wanted to reach out and thank you for your amazing research in your Market Timing Report.
I use it as one of my main barometers for making decisions on starting an investment or exiting one. As of 2020 I took control of my retirement investments and after working with the MTR, I have been able to nearly triple (3x) my retirement investment. Most of that has been in the last few months out of the 8-9 months that I have been subscribing.
So both getting used to how to best utilize your amazing research and general industry jargon I have taken control of my investments and look forward to huge achievements in the future eliminating debt and building wealth.
I love the extra time and effort you put into the MTR on the narrative of the month and global history lessons, you teach us to be humble and know that we will never know it all, but's its good to be as informed as possible through your valuable work.
Cheers to you and you team Andrew!"