Why 2026 Will Be A Defining Year For Grain Investors - And How To Be On The Right Side Of It.
How Top Traders Are Using Mathematical Timing To Forecast Massive Swings In the Grain Market – Without The Guesswork.
From the desk of Andrew Pancholi.
London, UK.
Dear Trader,
The 2025 Grain Reports provided incredibly accurate forecasts for those fortunate enough to have had them.
As traders and investors, we know that significant opportunities exist across a series of markets. This is particularly true for 2026 when we see major cycles coming in – some within the next few weeks.
So if this is of interest to you, then please don't delay.
Most Traders Rely on Trends. The Smart Ones Rely on Timing
Many of you are trend followers. Some of the greatest portfolio managers in the world have made their fortunes in trend following.
Trend-followers make money. But only when they get the timing right.
The real danger?
- Entering too late.
- Exiting too early.
- Letting a winning position reverse before you can react.
Without precise timing, even solid trades turn into stress – and losses.
Back in October 2020, Wheat had been ranging for 3 years. Volatility was low, traders had capitulated, committed to seeking gains elsewhere.
Most people were fully out of the markets and the general sentiment was extremely bearish.
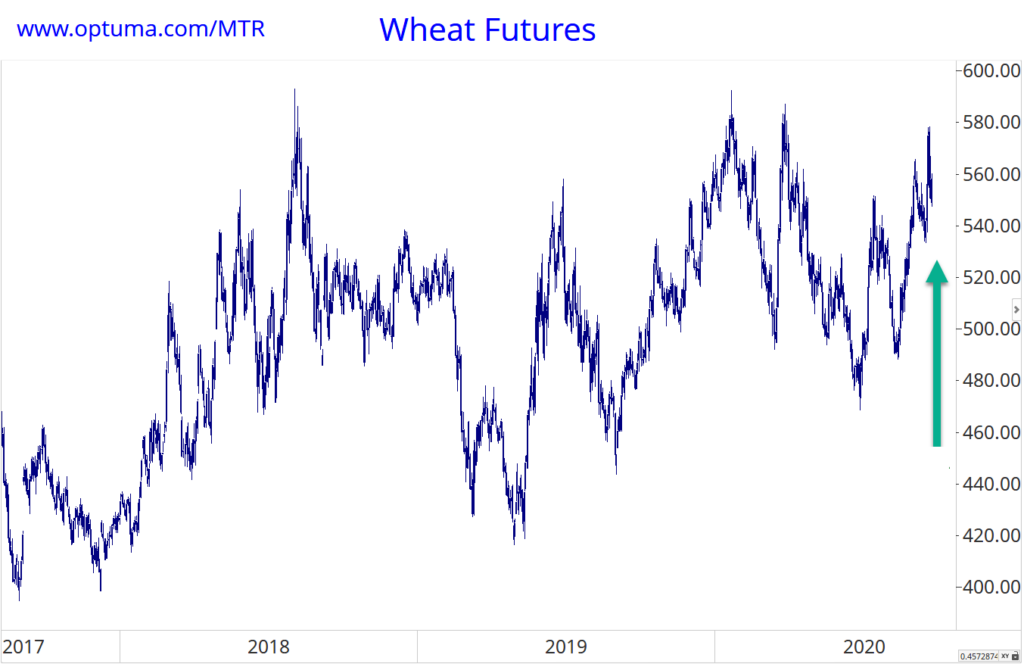
Right at this point, Our Grain Timing Report forecasted a rare long-term cycle turn in wheat- weeks ahead of the move. We were able to warn our commodity traders about a potential massive super long term cycle about to hit the wheat market.
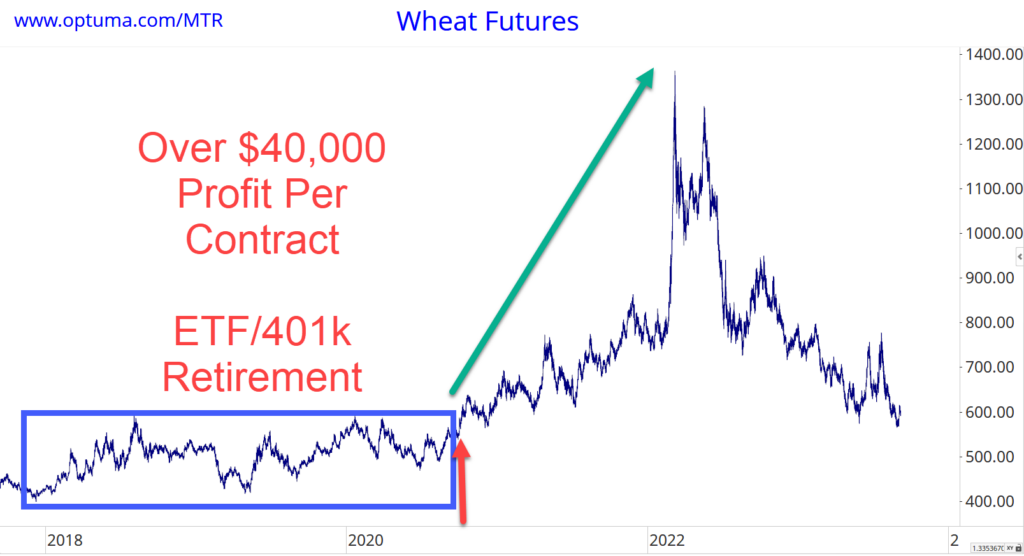
How the 2020 Wheat Trade Delivered $40,000 Per Lot
Then it hit.
The market took off, and when global events accelerated the trend, wheat nearly tripled.
- One report.
- One trade.
- $40,000+ per lot in profits.
Ukraine and other macroeconomic world events added fuel to the fire as wheat ended up nearly tripling off the lows.
Each contract on wheat yielded a profit of around $40,000+ per lot.
Subscribers- hedgers, fund managers, and even private investors- locked in multiple profitable contracts.
Some private traders ended up tripling their retirement accounts, 401Ks and superannuation accounts – thanks to a single trading campaign.
That’s what happens when you know what to trade, when to trade it, and how to ride the trend to its peak.
These results are not uncommon when you have the power of the Grain Timing Reports on your side.
This System Was Built for Institutions. You Get Access for a Fraction of the Cost
This isn't speculation. It's powered by our proprietary PFO – Profit Finding Oracle system.
We map:
- Monthly, weekly, and daily cycles.
- Forecasting major turning points to the day.
- With precision data previously reserved for institutional traders.
The result?
You know when trend reversals are about to happen… before the market reacts.
Could this add value to your trading, investing or hedging system?
Putting all this all together really gives us an edge.
Here’s What We’ve Already Identified in Soybeans (Through Feb 2026)

Our clients have access to forecasted blueprints like this:
- Blue Lines – Monthly cycles (called in advance).
- Magenta Lines – Weekly cycles (called in advance).
- Red & Green Arrows – Daily turning points.
You can see how they blue and magenta lines and also the red and green arrows picked out major turns.
And all identified in advance.
Most importantly, note that where cycles overlap, major reversals happen.
When weekly cycles coincide with monthly cycles, we get significant trend changes.
That's exactly what happened with the highs in February and November 2025 and the low in late July 2025.
If you were positioned at those turning points, you already know the power of this information.
If not… this is your opportunity.
Stop Letting Profits Reverse While You Wait for Confirmation
At the highs of Feb and Nov 2025, sentiment was bullish.
Everyone expected the trend to continue.
We knew better… and so did our subscribers.
While others watched their profits disappear, our clients exited with confidence and cashed in.
This is the edge the Grain Timing Report provides.
What You’ll Get Inside the Grain Timing Report
- Annual Forecast Curve – High-level roadmap of market moves.
- Major Turning Points for 2026 – Based on the PFO cycle system. These provide specific high probability turning point dates.
- Updated Monthly Reports - with high probability daily turning points.
- Risk Management Charts – For precise entry and exit zones.
- Daily Percentage Probabilities – Based on historical timing models.
- Seasonal Trade Setups – Filtered for alignment with this year’s forecast.
- ...And much more.
Now Available – Limited Release
Historically available only to institutions and funds for five-figure fees, the Grain Timing Report is now available to loyal Market Timing Report subscribers.
Due to the proprietary nature of this data, all sales are final. No refunds.
This is a condition of sale.
You’ll receive instant access via email the moment you complete your order.
Your questions answered
Market Timing Report FAQ's
What Is The Market Timing Report?
The Market Timing Report is a monthly report sent to paid subscribers that helps traders, investors, portfolio managers and hedge fund managers to gain significant advantages in the markets by knowing exactly when markets are about to change trend. It delves deeply into the S&P 500 Index, Crude Oil, Gold, the US Dollar Index, EURUSD currency and Bitcoin provides timing points for the upcoming month. The report also includes commentary on geopolitical events and their significance, in-depth market commentary, and includes data and analysis using proprietary systems such as our histograms that are not available anywhere else. One of the biggest challenges you face as a trader or portfolio manager is knowing when to enter or exit a trade or campaign. You get out too soon and miss out on profits, or you stay in too late and see your profits evaporate. The Market Timing Report helps reduce these issues substantially.
How Is This Information Created Or Derived?
Under each market chart, you will see a histogram. This is not volume. Each histogram is essentially a time-based graph spanning the day, week or month. They work in all time frames. These spikes indicate where our cycle analysis projects a high probability of a trend change. Think of it like a heartbeat monitor for the market’s timing. A spike means something is expected to happen around that time. The higher or more numerous the spikes, the more significant the expected move or turning point. We often refer to these as Profit Finding Oracle PFO histograms because they encapsulate the output of our proprietary cycle algorithm. Most importantly, when spikes from different timeframes align, we often get major market turns. Don't worry, we do all the interpretation for you and the key dates are clearly marked in each report.
Is This Report Right For Someone Like Me?
Absolutely! Whether you’re a seasoned investor or just starting, the Market Timing Report is tailored to cater to all serious investors and traders looking for a significant edge. It's designed to help the trader looking to sharpen their entry points, the portfolio manager wanting an edge through market timing, anyone who believes that mathematical cycles repeat like clockwork and for anyone looking to start or take control of their retirement or simply start an investment retirement plan.
What's The Risk To Me?
Investing always comes with its inherent risks, and The Market Timing Report is designed to help mitigate those risks through informed and strategic analysis. However, it’s crucial to understand that market conditions can change rapidly, and while our tool provides highly accurate predictions, no system can eliminate risk entirely. We encourage responsible investing, ensuring you are well-versed with the potential risks and rewards, helping you to make investment decisions that align with your financial goals and risk tolerance. Use your own trading and risk management systems. If you do not have one that works for you, then The Market Timing Report Trading Course will help you.
Is The Market Timing Report A Reliable Tool?
While no tool can guarantee 100% success, the Market Timing Report has a proven track record of guiding investors towards profitable decisions, making it invaluable in your investment journey. We review each month in the following issue and several years of track records are on this website. We also have more than ten years of customer testimonials who have used the reports to double, triple or even 5x their investment and retirement accounts. We have some of the largest funds in the world using The Market Timing Report. Our aim is to get the odds on your side. Successful trading and investing is all about making incremental gains.
Do I Need Any Additional Education To Be Able To Use The Report?
The Market Timing Report is comprehensive and standalone, providing everything you need to navigate the markets confidently. Many institutional and private traders use it alongside their own trading system to help gain an additional edge. However, for those eager to deepen their knowledge or people who don’t have a reliable trading system yet, we offer a range of educational materials and resources that complement the report, enhancing your understanding of market trends and investment strategies.
How Often Does The Market Timing Report Get Delivered?
The Market Timing Report is a monthly subscription that is delivered by the first trading day of each month. It covers the S&P 500 Index, Crude Oil, Gold, the US Dollar Index, EURUSD currency and Bitcoin timing or turning points for the upcoming month and includes an estimated view into the first weeks of the month following. This additional view is then clarified in the next report. This enables you to get an approximate view of about 5 to 6 weeks of market movement from the date of delivery to ensure you don't miss potential timing points. A full chart analysis is also included with key price targets and risk reward points. We use these alongside the turning point dates.
How Much Does The Market Timing Report Cost?
The Market Timing Report is available on two different plans. A monthly subscription cost of $149.00 or a yearly subscription cost of $997.00. The yearly plan saves you 44% compared to the monthly plan. Both subscriptions have a risk-free 28 day money back guarantee for people who have not tried the report before. Both plans include an outlook for the year ahead which is published during the first two weeks of January each year. Once subscribed, you have access to a members area. The members area contains a host of valuable reports. If you wish to cancel your subscription, please contact support@cyclesanalysis.com.
Do You Offer Any Advanced Courses About Market Timing?
Yes, we offer advanced courses tailored for investors who are already profitable and searching for that extra edge. For those who do not have a trading system, we offer The Market Timing Report Trading Course. This is suitable for beginners all the way up to senior portfolio and hedge fund managers. It is the exact trading system that Andrew Pancholi used when he very successfully ran a hedge fund. During the last year of operation it delivered returns of 34% beating the S&P 500 Index by 48%. The system is standalone and also works very well with the timing points in the Market Timing Report. We also offer The Advanced Seasonality Platform. This helps traders find shorter term probability moves. There is a calendar listing the highest probability moves on a daily basis. For those who wish to make longer term trades, we have The Master Traders Course and Smart Money Platform. This looks at what the smart money is doing based on weekly updated data. We identify potential moves in advance and this enables you to gain a significant edge. This is the closest thing to legal insider trading. We offer the Grain Reports for those who are trading corn, wheat and soybeans. These reports are updated on a monthly video. All these programs provide you with the tools and knowledge to anticipate market movements and enhance your profitability. They are suitable for individual profitable traders and investors, family offices, hedge funds or institutional investors.
Do You Offer Any Individualised Services?
Yes, Private consultancy with Andrew Pancholi is also available and we also have a Professional Services offer covering institutional research and global political trends. This later services is dedicated to releasing comprehensive market analysis to drive better investment decisions for investors with significant capital under management.