The
Finding opportunities in grain markets using mathematical timing without the guesswork.
Grain Timing
Take advantage of the super long-term cycles in the commodities markets.
Report
The Grain Timing Report lets you see the critical turning points in the grain markets.
ATTENTION TRADERS & INVESTORS
The Grain Timing Report is unlike anything else you will find for trading and profiting from the grain markets.
It gives traders an Annual Forecast Curve with roadmaps and major turning points generated from the Cycles Analysis Profit Finding Oracle system used exclusively by us at the Market Timing Report.
It gets updated monthly with daily turning points and includes daily percentage probabilities and seasonal set ups, so that you can find the highest probability trades that align to the year's forecast.
What You Need To Know About The
Incredible Upcoming Opportunities In Grain Markets in 2025
Mathematical Timing Without The Guesswork
From the desk of Andrew Pancholi.
London, UK.
Dear Readers,
The 2023-2024 Grain Reports provided incredibly accurate forecasts for those fortunate enough to have had them.
As traders and investors, we know that significant opportunities exist across a series of markets. This is particularly true for 2025 when we see major cycles coming in – some within the next few weeks.
So if this is of interest to you, then please don't delay.
Most Traders Aren’t Aware Of The Super Long Term Cycles About To Hit The Commodities Markets
Many of you are trend followers. Some of the greatest portfolio managers in the world have made their fortunes in trend following.
The challenge with trend following is you just don’t know when the trend is going to start and you don’t know when the trend is going to expire.
This leads to cutting profitable trades way too quickly. Or even worse, jumping into a trade too late and finding that the market has moved so much that you cannot manage the risk effectively.
Back in October 2020, Wheat had been ranging for 3 years. Volatility was low, traders had capitulated, committed to seeking gains elsewhere.
Most people were fully out of the markets and the general sentiment was extremely bearish.
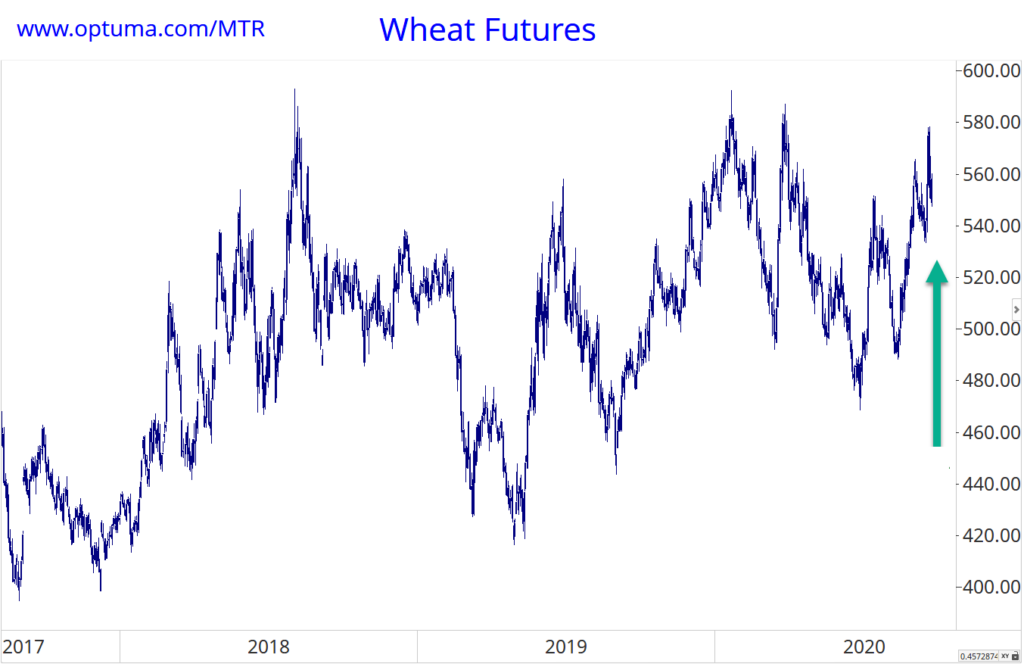
Right at this point, we published the Wheat Report, which warned our commodity traders about a potential massive super long term cycle about to hit the wheat market.
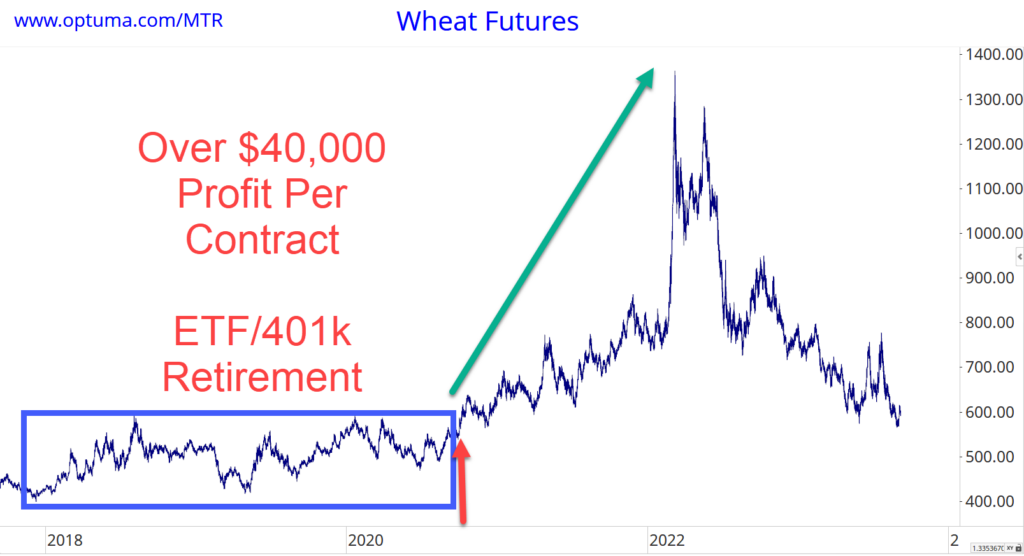
Precisely as forecast, we hit the turning point mentioned in the report, and off went the Wheat market, flying up.
Ukraine and other macroeconomic world events added fuel to the fire as wheat ended up nearly tripling off the lows.
Each contract on wheat yielded a profit of around $40,000+ per lot.
Our Grain Timing Report subscribers – many of whom are seasoned grain hedgers, commodity veterans and commodity traders were able to lock in significant numbers of these profitable contracts.
Some private traders ended up tripling their retirement accounts, 401Ks and superannuation accounts – thanks to a single trading campaign.
The potent combination of what to trade, when to trade it and how to trade it massively paid off.
These results are not uncommon when you have the power of the Grain Timing Reports on your side.
Could this add value to your trading, investing or hedging system?
These turns are derived from our PFO – Profit Finding Oracle – indicators. This allows us to fine tune the turning points.
We use different sets of these in different time frames to identify turning points down to within a day or two.
Putting all this all together really gives us an edge.
Here are all the turns that we identified on the wheat market right up to September 2023.
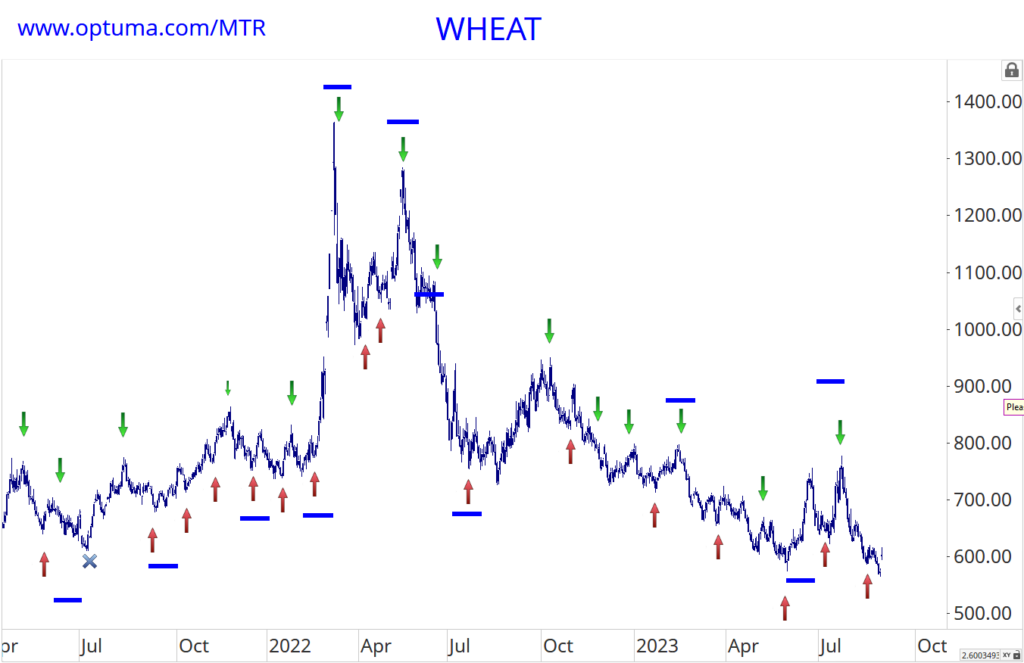
The blue lines are monthly cycles that were identified in advance. You can see how they picked out major turns.
The red and green arrows identify weekly cycles that were also identified in advance. Again, you can see how they picked out major turns.
Most importantly, note that when we see weekly cycles coinciding with monthly cycles, we get significant trend changes. That's exactly what happened with the two major highs and several other key swings.
Now, if you were trading these markets at the point of these two major highs, you will remember that sentiment was such that many people were expecting wheat to trade at $20 or 2000 on this chart.
However, you are forewarned and forearmed with these key turning points, and you are able to capitalize on profits knowing that a reversal is about to take place.
Those who remained in the trade were hit with a very sudden and sharp reversal which not only gave away profits for many but also turned the positions into loss makers for others.
This is the power of market timing and the grain reports.
Would this information be valuable to you? This phenomenally accurate timing system is the output from a multi-million dollar system that was previously only made available to major banks, funds and institutions. You can now access this for a fraction of the price.
How would this help you when combined with your trading system?
Benefits
- Annual Forecast Curve providing roadmaps.
- Major Turning Points for 2025 in Master Report generated from the Cycles Analysis Profit Finding Oracle system. These provide specific high probability turning point dates.
- Updated Monthly - with daily turning points.
- Daily Percentage Probabilities & Seasonal set ups.
- HIGH PROBABILITY SEASONAL TRADES aligning with this years forecast
- AVAILABLE NOW!
Many subscribers to The Market Timing Report have been requesting this information.
Historically these reports have been made available to Funds and Institutions for FIVE FIGURE sums.
Following numerous requests from readers of The Market Timing Report we have decided to release them to our loyal subscribers.
Due to the nature of the information, all sales are final and no refunds are permitted.
This is a condition of sale.
You will receive an email with the access link immediately upon ordering.
What our members
are saying
Position Strategically Before the Markets Turn
I have been a follower of Andy’s cycle analytics for many years and I find them very helpful in positioning my portfolio in the markets. The 90 year cycle has been very important, especially given the longest bull market in history and the fact that the ‘elastic band of the markets’ was already very stretched, and Andy’s work enabled me to remain alert get mainly into cash before the markets turned. Knowing when cycles are likely to occur is essential trade decision assistance information and part of a balanced approach to the markets. Thanks for your knowledge and your great work Andy!

John Morris, FX Blue
The Best System I’ve Ever Seen for Trading Success
I have followed Andy’s work for 18 months now and I am astounded by his knowledge of the markets, in particular the analysis of economic cycles. It has completely changed my outlook on trading for the better, from the analysis of the charts to the execution of the trade. I now use a combination of market cycles, chart geometry, Andrew’s Pitchforks and Commitment of Traders data. I feel that I have much more probability on my side, which is the aim of the game! The MTR Trading Course is the best and most executable system I have ever seen. I have made significant returns with safe risk management.
Dr Richard Malloch
From Frustration to Financial Success
I wanted to share with you and your team the success that I’ve been having since implementing your system and your Market Timing Report. I’m very thrilled to share that over two days, I paid for your entire course and one years subscription through commodities trading and following the system. It was huge! However, it doesn’t end there. Through your risk mitigation strategies, I was able to protect myself when the market turned a few months later. It was a game changer that previously would’ve sunk me. As a beginner in the trading realm, I’ve only ever had bad outcomes and muddling through which resulted in losses after losses. So, I stopped trading in frustration. However, your trading system and your monthly reports (plus words of wisdom) have enabled me to take control of my trading and investments. I highly recommend your course, your system and your market trading reports to those who are serious about taking control of their financial success.
Ketan Ladva, Vancouver, CA
The Most Accurate Cycles Forecast for Major Markets
Andrew Pancholi’s Market Timing Report is consistently the most accurate cycles forecast there is for traders of major markets.
Peter Temple
Unmatched Expertise in Cycles Analysis
I’ve known Andrew for a number of years. He knows cycles better than anybody I’ve ever met, and I’ve studied cycles all my life.
Harry S. Dent, Renowned Forecaster and New York Times Best Selling Author
Essential for Success in Volatile Markets
The MTR is the most progressive way to make informed choices on how to position yourself even in the most volatile markets. The information and time cycles published are absolutely invaluable to our success.
We would recommend these services to any serious investor.
Daniel Malsbury, City Of London Markets
Your questions answered
The Grain Timing Report FAQ's
What Commodities Does The Grain Report Cover?
The Grain Report looks primarily at the corn, soybean and wheat cycles with the view of providing subscribers the opportunity to bring multiple data points together to facilitate decision making, be that trading or otherwise. These data points including macro, micro, geopolitical and seasonal data that helps you to create a view of the markets and their potential turning points and trend changes throughout the year.
What Do The Corn, Soybean, And Wheat Cycles Reports Offer?
Each Grain Cycles Report provides a multifaceted analysis to anticipate market turning points over the next 12 months. We utilize proprietary mathematical time cycles to identify when major trend changes are likely, giving you advance notice of high-probability price reversals. In addition, the reports include:
• Seasonal probabilities: insights into typical seasonal price patterns and tendencies (e.g. which months grain prices tend to peak or trough), backed by historical data. We provide probability tables and seasonal trend charts so you know the seasonal biases each year.
• Geometry analysis: long-term price chart “geometry” identifying key support and resistance levels. For example, we draw important trendlines and price projections on decades of price history to highlight where future rallies or declines may stall. When price hits these geometric levels at a cycle turn date, significant reversals often occur.
• Trend forecasting models: a forward-looking roadmap for price direction. Using advanced modelling, we plot an indicative trend line for the coming year (separate from price itself) to suggest where major inflection points could happen. This is a coarse forecast of market rhythm (not exact prices), which, when aligned with our cycle dates, adds confidence to timing.
By blending time-cycle analysis, seasonality, chart geometry, and trend models, each report gives you a well-rounded toolkit for anticipating market moves. All insights are clearly explained – you do not need to crunch any numbers yourself. The goal is to equip you with a big-picture timing edge for the corn, soybean, and wheat markets.
How Can Farmers, Hedgers, And Traders Use These Cycle Insights?
These reports are designed to support producers, hedgers, traders, and investors alike in making better timing decisions. Here are ways different users can apply the insights:
• Farmers & Producers: Use cycle projections to time your planting, harvesting, and crop sales more strategically. For example, if the report indicates a probable price peak around early summer, a farmer might plan to forward sell a portion of the crop before that window. Likewise, if a cycle low is expected during harvest season, you might choose to store grain and wait for a post-harvest rally before selling.
• Hedgers: The cycle dates can guide hedging programs. If you’re an ethanol producer or feed processor needing corn or soy, knowing when a seasonal low or cycle low is likely can inform when to lock in prices. Conversely, if a major cycle high is projected, hedgers can tighten risk controls or use options to protect against price spikes, improving margins.
• Futures Traders & Investors: Traders benefit by using cycle turn dates as trade entry or exit signals. For instance, a commodities trader might go long ahead of a forecasted cycle bottom or take profits/short as a cycle top approaches (with confirmation from their own technical indicators). The reports provide monthly and weekly timing overlays that traders can integrate with their existing strategies – think of it as an early warning system for trend changes to tilt the odds in your favor.
How Does The 1-year Subscription Work?
The 1-Year subscription includes the annual Master Report and ongoing monthly updates. Here's what's included:
• Annual Master Cycle Report: At the start of your subscription (and each year you renew), you’ll get the comprehensive Corn, Soybean, or Wheat Master Report for the upcoming year. This PDF report lays out all the major cycles, seasonal patterns, and forecasted trend roadmap for the next 12 months. It’s the foundation, identifying key months and likely trend-change timeframes well in advance.
• Monthly Updates: Each month, we send you an update with refined cycle insights and any new developments. Markets are dynamic, so these updates fine-tune the timing windows—down to specific weekly/daily turning points—based on the latest data. For example, if the Master Report highlighted a broad turn in “late September,” a monthly update might pinpoint it to a particular week or day as we get closer. You’ll receive one update per month, ensuring you’re never trading on outdated information.
• Weekly Cycle Overlays: Within the reports and updates, we break down the macro cycles into weekly and even daily cycle “turn” dates during each month. This helps short-term traders know the critical week or day to watch for a reversal.
• “Profit Finding Oracle” Timing Dates: All our timing points are generated by our proprietary Profit Finding Oracle (PFO) system – a unique feature of this service. The PFO crunches countless historical cycles and geometries to spit out specific high-probability turn dates for each market. As a subscriber, you get access to these exclusive dates (both major and minor turns).
• Video Commentary & Explanations: We know visuals and discussion can enhance understanding. That’s why the subscription includes periodic video updates where our lead analyst, Andrew Pancholi, walks through the latest charts, cycle overlays, and market context. It’s like a monthly mini-webinar to complement the written reports, ensuring you grasp the insights even if you prefer listening/watching over reading.
• Commitment of Traders (CoT) Insights: Subscribers also gain access to valuable analysis of the weekly CFTC Commitment of Traders data for grains. Our team breaks down the CoT reports to show when commercial hedgers or large speculators are at extreme positions (e.g. historically high buying or selling pressure). These extremes often coincide with impending reversals. By seeing the CoT trends alongside our time cycles, you get an extra layer of confirmation.
Does The Subscription Include Updates?
Yes. When you subscribe, you receive an annual Master Report plus ongoing monthly updates for a full year. The 1-year subscription is an all-inclusive package. You get the big-picture yearly game plan and continuous guidance throughout the year. It’s designed so you’re never on your own. You’ll always know what the latest cycles are indicating on a monthly and weekly basis, and you’ll have support materials, including monthly video updates, to back it up.
Do I Need To Be A Technical Trader To Use These Reports?
No, not at all. You do not need any specialized technical analysis knowledge to benefit from our cycles reports. We’ve designed the content to be accessible and practical for all types of users, from a busy farmer to a seasoned futures trader. The analysis itself is complex under the hood, built on 20+ years of cycle research and data mining, but we take care of the complexity for you.
Each report and update distills the findings into clear language and actionable guidance. You’ll see simple summaries like “A major cycle peak is likely in late June” or “Watch for a trend reversal around November 10–15”. We highlight the key dates and probabilities, and often provide charts with arrows or markers for those turn windows.
In other words, the reports function as a straightforward timing tool anyone can follow. If you’re not a technical trader, you might use it as a planning calendar to mark the potential high or low dates on your schedule to make marketing decisions. And if you ever have questions on how to interpret something, we’re here to help clarify.
The bottom line is that these reports are for everyone who deals in the grain markets, not just quants or chart analysts. Many fundamental-focused users actually love our service because it adds timing insight without them having to become technical experts.
How Reliable Are The Predictions?
Our cycle forecasts are grounded in data and historical evidence, not hunches. We use rigorous statistical and mathematical methods to uncover recurring patterns in market history. The research behind these reports spans decades and even centuries of market cycles. We look at how similar conditions repeated over 50-year, 90-year, or even 200-year intervals, and we test these patterns extensively.
When we highlight a timing signal, it’s because the probability of a turn is statistically elevated at that point. This methodology has successfully anticipated major market moves in the past. That said, no forecast is 100% certain. Markets can always throw curveballs. We are providing an edge, not a crystal ball. Think of it this way: if you know there’s a 70% chance of a significant high or low this month, you’re already ahead of the game, even though there’s a 30% chance it doesn’t pan out due to unusual factors.
We openly acknowledge that cycles can sometimes “invert” or timing can shift slightly. This is why we always recommend using our cycle signals in conjunction with sound risk management and your own knowledge of market fundamentals. If the market is trending strongly and a cycle turn is due, it could mean a reversal or an acceleration of that trend. In either case, it’s a critical time to pay attention.
Can I Use Cycle Analysis Alongside Fundamentals Like Weather Or News Events?
Absolutely. In fact, we encourage it. Our cycle insights work best in tandem with fundamental analysis, not as a replacement. Think of cycles as the when to fundamentals’ what and why. Often, the cyclical patterns will flag when something significant is likely to happen in the market, and the fundamentals will explain what that event is (such as a drought, war, policy change, etc.).
Many of the patterns we identify correspond to fundamental phenomena that tend to recur over time. For example, the grain markets are heavily influenced by weather cycles. History shows roughly 90-year cycles in climate extremes – the classic case being the 1930s Dust Bowl drought in the U.S.
Our reports have pointed out that we are entering a similar cycle window in current times, suggesting farmers should be alert to possible drought threats or yield shocks in the coming years that echo those historical events. The key point is that you don’t have to choose between cycles vs. fundamentals. Use the cycle timing to enhance your fundamental strategy.
Links
Home
About Us
Track Record
Contact Us
Testimonials
Products
The Market Timing Report
The Market Timing Report Trading Course
The Master Traders Course and Smart Money Platform
Advanced Seasonality Platform
The Grain Timing Reports
Contact
Links
Home
About Us
Track Record
Contact Us