Master Traders Course
Follow the Smart Money and Reap the Rewards.
and
The Smart Money platform lets you see what the big movers of the markets are doing AND you get access to our monthly power sessions.
Smart Money Platform
The major players are the ones that move the markets. They are called the “commercials” and where they go, the money flows.
ATTENTION TRADERS, INVESTORS, FUND MANAGERS AND PORTFOLIO MANAGERS
Join The Master Traders Course & Smart Money Platform by Andrew Pancholi
From the desk of Andrew Pancholi
Dear Friends,
How would your trading and investing be improved if you knew, with confidence…
When a market is about to turn
When a trend is likely to continue.
Which markets to focus on
What the smart money is doing
When capitulation may take place
High probability seasonal trades
When the seasonal trades are going to work the best
AND….
You have proprietary weekly time cycles on the Australian Dollar, British Pound, Canadian Dollar, Euro, Japanese Yen, New Zealand Dollar, Swiss Franc as well as S&P 500, Crude Oil, Gold, Dollar Index and Bitcoin.
Will this information be useful to you?
What The Professionals Know & How They Use It
How The Smartest People Make Significant Profits
Professional traders know that there is no Holy Grail to making money.
They also know that success in trading and investment comes through getting the odds on your side.
For years, you have been asking us for access to the market intelligence we use.
We have now created the “Master Traders Course” that comes along with “The Smart Money Traders Platform”.
Our focus is on identifying high probability setups in order to minimise risk and maximise profit.
How do we do this?
We combine 4 of the most powerful sources to truly get the odds on our side. These are:
- Power Resource 1 - Seasonality
The natural patterns that enhance trading
- Power Resource 2 - Commitment Of Traders Data
Knowing what the smart money is doing. Following the professionals who move markets
- Power Resource 3 - Weekly Time Cycles on 6 Additional Instruments
Without doubt the most powerful part of this platform. Only we have this data from our proprietary system and hedge funds have been buying this alone for five figure sums. As subscribers of The Market Timing Report, you are already receiving the weekly cycles on S&P500, Gold, Crude Oil, EURUSD, Dollar Index and Bitcoin.
- Power Resource 4 - Access To Monthly Power Calls by Andrew Pancholi
Access the recordings of all monthly Power Calls conducted by Andrew Pancholi with industry experts, and the chance to submit your questions before the call & get them answered by Andrew and his guests!
Let's dive in a little deeper…
Power Resource 1: Seasonality
Seasonality is the average path of the market throughout the course of the year. We can get a lot of information out of this and many traders use this.
However, we have raised the game – we have improved our seasonality profiles using a proprietary system. This makes them significantly more powerful. We explain how this is done within the course.
Take a look at this chart of crude oil.
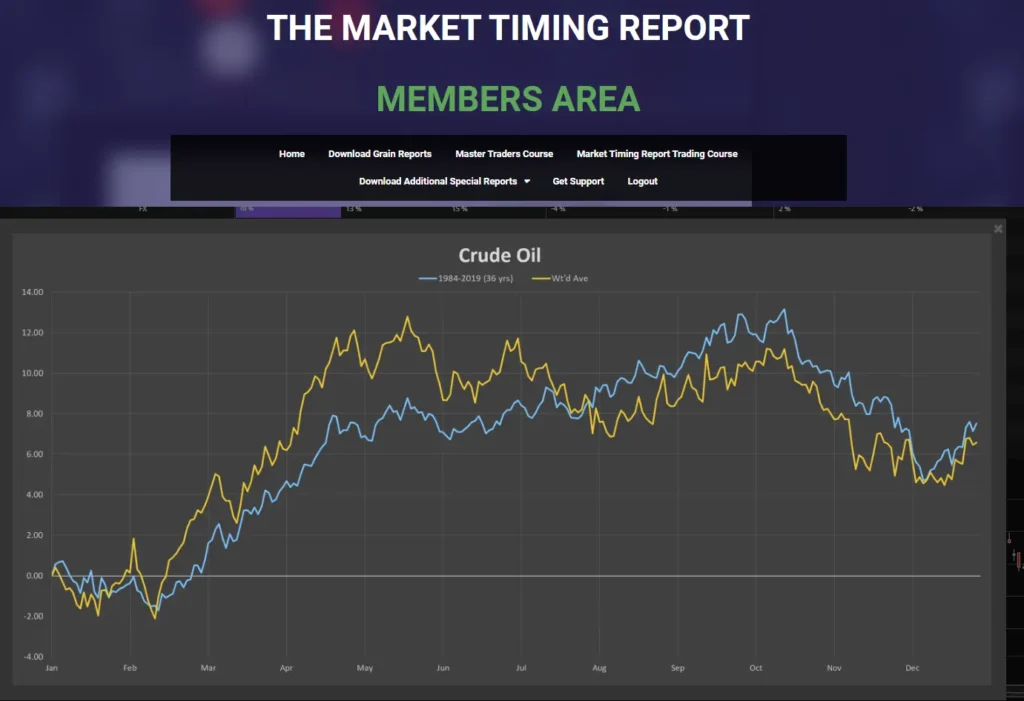
The blue line is the path of seasonality and during the year averaged since 1984. You can clearly see that oil tends to make lows in February and highs in May as well as October.
However, this is not always the case. Sure, you will more than likely make money just trading these long cycles. But we’ve added our proprietary seasonality which shows us areas when the seasonal cycle is going to work at its best.
In this following chart we are comparing the regular seasonal cycle with our own proprietary seasonal cycle chart.
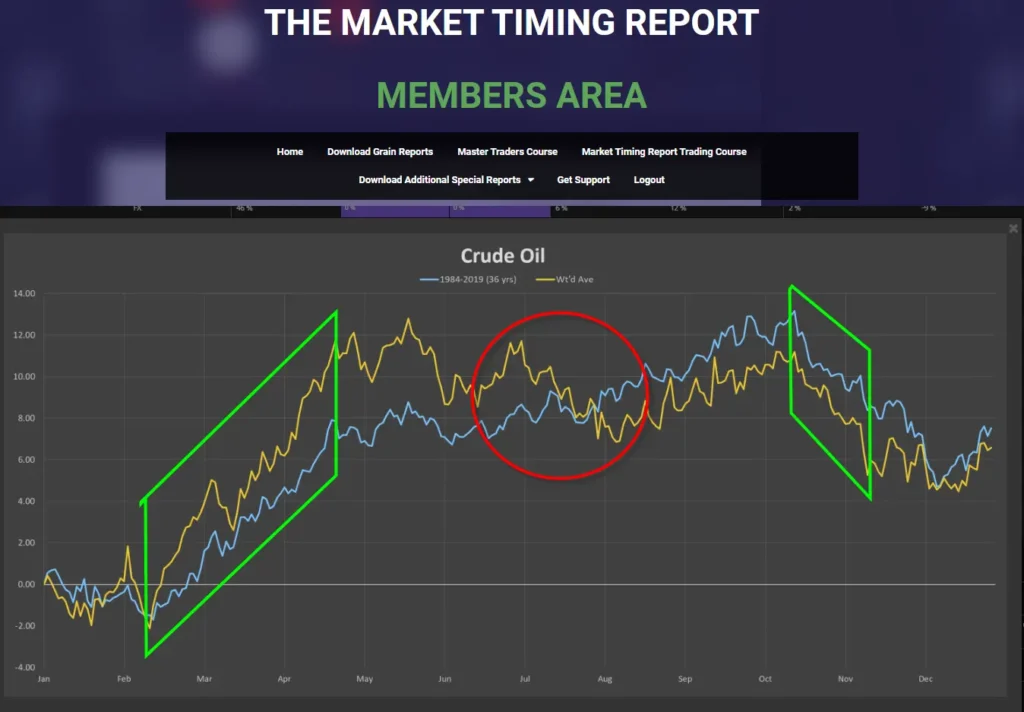
Take a look at the area within the red circle. The blue line (path of normal seasonality) continues up whereas our gold line proprietary seasonal cycle comes down. A simple way of explaining this is that this is not a reliable seasonal trade area.
We dramatically increase the odds of being successful in seasonal trading when we trade the areas where the both the blue and gold lines move in the same direction. These are shown within the green sectors.
It’s a simple as that!
The Smart Money Traders Platform has these patterns for over 40 different instruments.
This provides you with a distinct advantage right out of the gate.
You can trade on this methodology alone. However we can enhance this and get the odds even closer on our side by looking at what the smart money is doing.
Power Resource 2: Commitment Of Traders Data
Every week, the US government requires that all trading positions are reported on a weekly basis. These reporting groups are broken down into 3 categories.
Putting it simply, we can identify what the smart money is doing and follow them. We also get clues from the other categories.
This is fully explained in the CoT course.
A brief explanation is as follows:
“Commercials” are the group of people that drive the market. They effectively dictate what’s going on.
Why is this?
It is because they are usually producers or users of the commodity or instrument. They usually account for at least 60% of the market. By following what they do we are effectively capturing the major trends AND reversals. When these people get to extremes of buying or selling, we know a change in trend is very likely.
If they believe a commodity is priced too cheaply they will start buying it and equally if they believe a commodity is too expensive then they will sell it. Our Professional Traders Platform alerts us to when these potential changes are going to occur.
The other group of people that we are interested in are the “Non-Commercials”. These people are big trend followers. They will be wrong at the beginning and end of trends. However they can also provide us with trend confirmation signals.
The platform is not just an import of the Commitment of Traders data from the government website. It breaks the data down into incisive information from which clear decisions can be made.
Here are just a few of the many insights explained in the 19 modules of the CoT Trading Course.
Using our very own COT Index, we are able to identify when markets are reaching extremes of moves.
This is how we are forewarned of impending change.
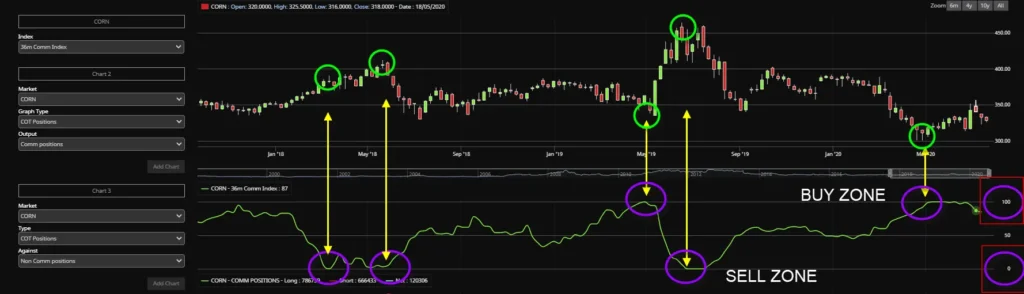
Take a look at this shot from our platform.
On the right hand side you will note two red squares. The higher one shows a reading of 100 and the lower one shows a reading of 0.
Now observe the green index line in the lower half of the image.
This is our COT Index.
When it hits a reading of 100 we enter the buy zone. This is when the commercials have reached an extreme of activity. So the market is now highly likely to head up. This is fully explained in the course. Conversely, when the index hits a reading of 0 we are in the sell zone. Commercial activity is exhausted at the opposite extreme and the market is likely to head down. Observe the green and purple circles.
The primary focus is to protect existing positions running into these windows and seek profit taking targets.
We then use other factors to confirm potential trend change and deploy the appropriate techniques to establish risk reward ratios and entry exit techniques to capitalise on reversals. This is further enhanced with the use of seasonals as well as time cycles.
To make life easier we display these every week in the Cot Index Grid.
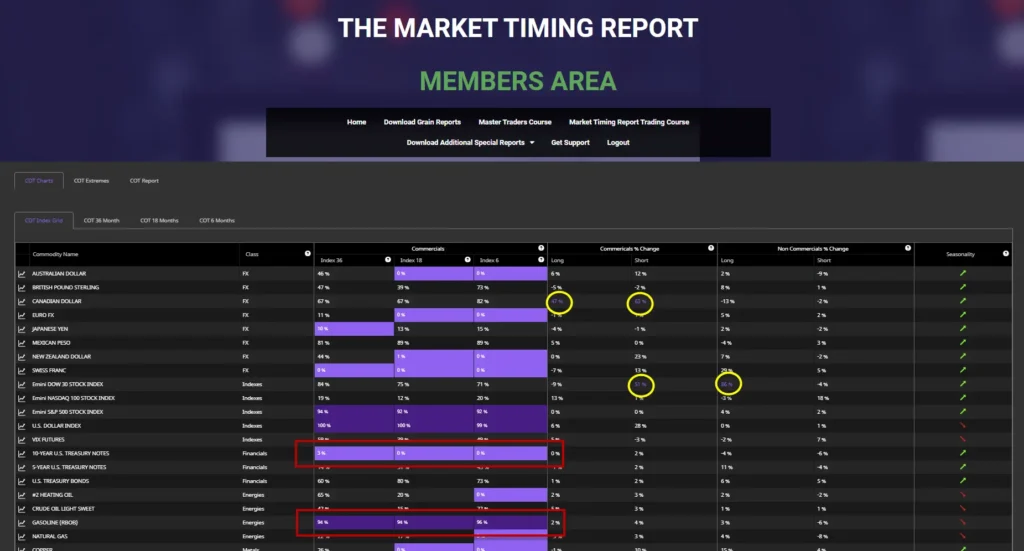
Where we see three sets of numbers all close to 0 or 100 we get flashing alerts as shown by the red boxed areas. These are the markets that are about to potentially reverse.
This saves you having to wade through masses of CoT data.
You can immediately recognise which markets to focus on.
Also highlighted are extreme moves which are circled in yellow again showing us where to look for potential trading opportunities. Again this is fully explained in the course.
The platform also allows us to recognise trend confirmation signals as well as potential reversals. These flash on a separate page:
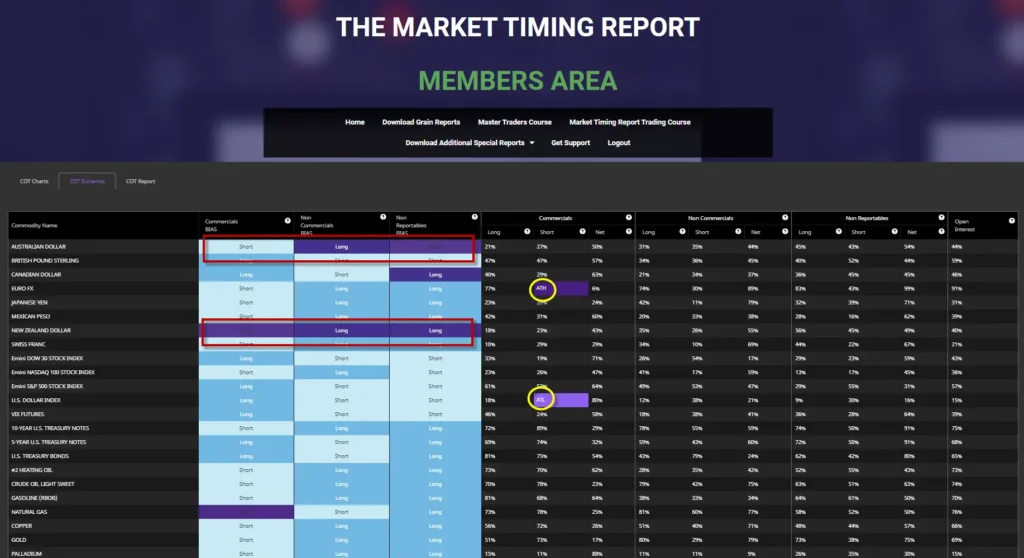
The page above highlights substantial changes in net positions between the different categories of traders. When this occurs, we get important indications of either trend continuation or potential reversal.
Any extreme changes in positions are highlighted in the yellow circles and again suggest potential new trends in the making.
These are just a few of the key features of our Smart Money Traders Platform – alert us to markets that may be on the verge of moving. It allows us to act on what the smart money is doing.
Power Resource 3: Six Additional Sets Of Weekly Time Cycles
Most of you are already fully aware of the powerful effect of our Profit Finding Oracle Histograms. These track the DNA of the market and are laser guided in identifying future turning points. They are the basis of The Market Timing Report.
Subscribers of The Market Timing Report will already receive the weekly cycles on S&P500, Oil, Gold, EURUSD, Dollar Index and Bitcoin.
In addition to the 6 markets that are covered in depth in the The Market Timing Report, we are adding weekly cycles for 6 FX instruments – AUD, CAD, CHF, GBP, JPY and NZD. These will help fine tune potential turning points from both our advanced seasonality module and also the Commitment of Traders Data. COT data is released weekly and hence we are providing weekly cycles.
These are the most important and accurate forecasting tools available. They are derived from our cycles analysis system and are not available anywhere else. People and institutions have paid 5 figure sums to access these turning point dates.
For those of you that are not familiar with this extraordinarily accurate data, take a look at this weekly chart of the British Pound – GBP.
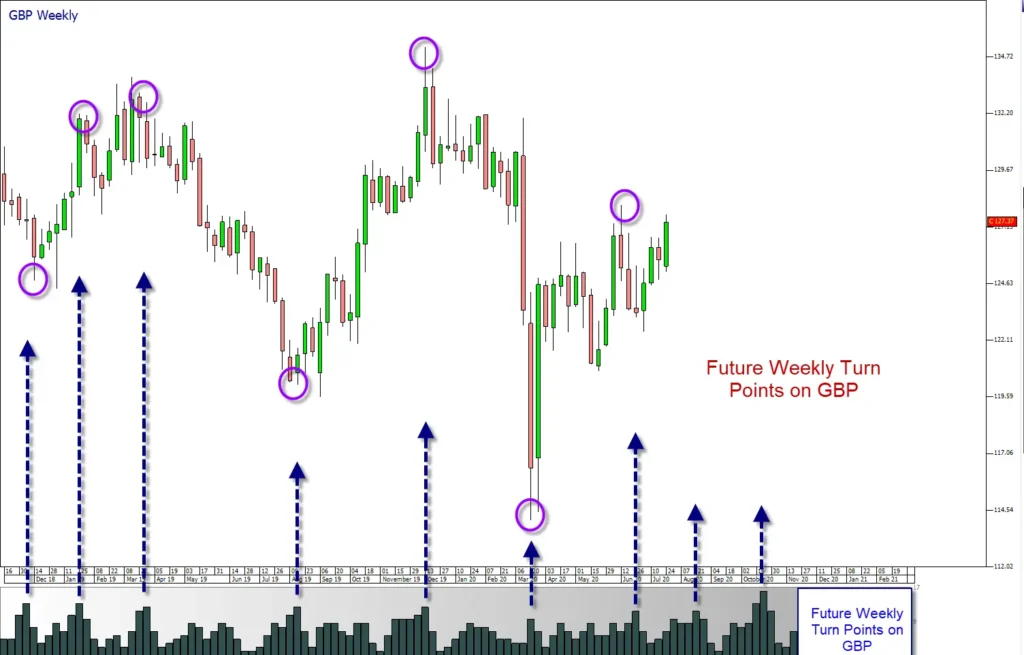
Where the histograms spike – as shown by the vertical blue arrows – you will see significant changes in trend. These are forecast in advance. In the chart above you will see to future spikes in these dates will be made available to subscribers to the Master Traders Course and Smart Money Platform.
They greatly enhance the accuracy of timing the markets and are extremely powerful when combined with both seasonality and COT data.
These cycle dates will be delivered by email to subscribers.
Any one of these single Power Resources will give you, as a serious trader, a distinct advantage.
Being able to combine all 3 techniques really does get the odds on your side.
You will have all this information at your fingertips.
This is the same knowledge that professional traders deploy and exactly what we use in running our fund.
A word of caution – this is not for everyone. This is only for people who are prepared to put the work in to make this knowledge their own and in so doing, desire to take control of their own financial destiny.
The content of the Master Traders Course and Smart Money Platform is especially powerful when combined with The Market Timing Report Trading Course (MTRTC). The MTRTC teaches you strict money management rules together with the very best techniques in trading and investing.
Many of you have studied this course already. You already know how to clearly identify market entry points. You also know what your initial price targets are going to be. One of the most valuable part of this course is knowing how to project a potential final price target for a move. These are the exact same techniques we use to run our fund with.
Power Resource 4: Access to Monthly Power Calls by Andrew Pancholi
Each month you can send in your specific questions directly to Andrew and get them answered by Andrew and his guests! You also get access to the monthly call recordings, enabling you to review the answers and information as it suits you.
Putting a monetary value on this power resource alone is almost impossible when you consider the years of experience and wealth of information you receive from each month's call.
As well as these 4 Power Resources, we have added a series of bonus items.
These are:
Advanced Seasonality Cross Rates On:
- AUD
- GBP
- CAD
- EUR
- JPY
- NZD
- CHF
- US Presidential Year Cycles
- Stock Index Seasonality
- US Sector Seasonality
THE MASTER TRADERS COURSE AND SMART MONEY PLATFORM
You get access to the following:
- Course on Seasonal Trading
3 Modules that explain Seasonal Trading
- Seasonal Market Trends
Seasonal trends across the markets listed below – 40 brief modules
- Commitment Of Traders Data Course
Course on Commitment of Traders Data – 19 modules
- Bonus Items
– Advanced Seasonality Cross rates
– US Presidential Year Cycles
– Stock Index Seasonality
– US Sector Seasonality
- Access To Monthly Power Calls
Access to call recordings to Monthly Power Calls conducted by Andrew Pancholi & the chance to submit your questions & get them answered by Andrew and his guests!
We genuinely believe that The Master Traders Course and Smart Money Platform is the most valuable system we have ever created. We have invested substantially in developing this platform that will allow you to rapidly analyse a wide range of markets in an efficient manner.
It will enable you to find opportunities that most traders will miss. You will also be alert to them much sooner than most. This in turns vastly improves your risk management.
We are strictly limiting the number of people that will be permitted to access this platform.
Last year we worked with a small number of people to develop this program – they paid over $22,000.00 each. Many of them have made several times this amount over.
We want to make this affordable to those of you who are prepared to commit to learning these advanced trading and fund management techniques and so will be making The Master Traders Course and Smart Money Platform available for $3995 for the first year.
After 12 months the cost of access to the platform and time cycles will be $199 per month.
You can cancel at the end of the first year if you feel that this course, the advanced seasonality profiles, Cot Platform and proprietary time cycles have not been of value to you.
You will receive instant access to the platform on purchase.
You can now access the entire platform right now for USD $3,995.00 for the first year
Thereafter, $199 USD / month
$3,995 USD
thereafter $199 USD/ m from the second year onwards
All sales full and final. This is a one off promotion with no refunds
Instruments Covered
The platform has full Advanced Seasonality and Commitments of Traders data for the following instruments:
- Bitcoin
- Bitcoin Micro
- Ethereum
- Australian Dollar
- British Pound Sterling
- Canadian Dollar
- Euro
- Japanese Yen
- Mexican Peso
- New Zealand Dollar
- Swiss Franc
- E-Mini Dow 30
- E-Mini NASDAQ 100
- E-Mini S&P500
- Nikkei 225
- US Dollar Index
- VIX Futures
- 10 Year US Treasury Notes
- 5 Year US Treasury Notes
- US Treasury Bonds
- Crude Oil
- Gasoline
- Natural Gas
- NY Harbor ULSD
- Copper
- Gold
- Palladium
- Platinum
- Silver
- Chicago Wheat
- Kansas City Wheat (HRW)
- Corn
- Soybean Meal
- Soybean Oil
- Soybeans
- Cocoa
- Coffee
- Cotton
- Orange Juice
- Sugar
- Lean Hogs
- Live Cattle
Bonus Items
We also feature:
US Presidential Year Cycles On
Stock Index Seasonality
- S&P500
- Crude Oil
- Euro
- British Pound
- Australian Dollar
- Japanese Yen
- Gold
- Silver
- US 10 Year Notes
- S&P500
- VIX Futures
- Dow Jones Industrial Average
- NASDAQ 100
- French CAC
- Japanese Nikkei
- Hong Kong Hang Seng
- Australian All Ordinaries
US Sector Seasonality
Proprietary Weekly “Profit Finding Oracle” Time Cycles On
- Consumer Discretionary
- Consumer Staples
- Energy
- Financials
- Healthcare
- Industrials
- Materials
- Utilities
- Technology
- Australian Dollar
- British Pound
- Canadian Dollar
- Euro
- Japanese Yen
- New Zealand Dollar
- Swiss Franc
A TREASURE CHEST FOR CURRENCY TRADERS AND ALL TRADERS
Get Access To The Master Traders Course And Smart Money Platform Today
$3,995 USD
thereafter $199 USD/ m from the second year onwards
All sales full and final. This is a one off promotion with no refunds
Terms And Conditions
By placing an order, you understand and agree to the following terms:
· The price includes one year subscription to the Master Traders Course and Professional Platform.
· Thereafter, this renews at USD $199 per month.
· The Commitments of Traders data is provided by the CFTC and issued weekly on Fridays. We cannot be held responsible for any data outages created by the CFTC/US government.
· All sales are full and final – due to the nature of the materials contained within we are unable to offer any refunds on purchases. Please contact us to get your questions answered in advanced to determine if this is a good fit for you.
· More terms and conditions can be found here
How Much Longer Will You Keep Missing Profitable Moves?
While you're relying on lagging indicators showing last week's move the real opportunity has already passed
The Smart Money Platform lets you see the big movement signals right NOW, so you can reap even bigger gains.
You know the frustration. Watching profits slip through your fingers as the big money has already made the play long before your indicators even twitch.
It's painful. Every missed move is more evidence you're playing from behind.
Here's the truth: The big commercial players are the ones moving the market.
They own it.
This platform lets you see what they're doing as they are doing it so you can get in at the ground floor of the action.
It's time to stop reacting. It's time to proactively capture bigger gains.
We call it “legal insider trading.”
Putting it simply, the Master Traders Course and Smart Money Platform identifies what the smart money is doing so you can follow them.
The commercials are producers or users of the commodity or instrument. They usually account for at least 60% of the market movement. By following what they do we are effectively capturing the major trends AND reversals.
When these people get to extremes of buying or selling, we know a change in trend is very likely. If they believe a commodity is priced too cheaply they will start buying it and equally if they believe a commodity is too expensive then they will sell it.
Our Master Traders Course and Smart Money Platform tracks their movement and alerts you – then you can take advantage of it.
Here’s what you’ll find inside:

At-a-glance analysis
Clear Market Signals
– See exactly which instruments the smart money is moving in right now — Transform frustration into confidence as you position yourself alongside the market movers instead of constantly playing catch-up.
Seasonal Pattern Confirmation
– Instantly identify when commercial activity aligns with seasonal trends — Eliminate unnecessary risk and sleep better knowing you have multiple confirming factors supporting your trading decisions.
Commercial Position Size Indicators
– Measure the magnitude of smart money movements in real-time — Replace uncertainty with conviction as you recognize which market moves warrant your immediate attention and capital commitment.
Training course
How To Read The Data
– Quickly recognize patterns and signals that most traders miss completely.
How To Use The Data
– Transform raw data into decisive action with confidence.
How To Trade The Data
– Learn the precise entry and exit techniques specific to commercial activity.
Efficient Learning
– 19 focused modules most under 10 minutes, designed for people who value results over theory.
Power Calls
Trading Community Intelligence
– Join a select group of serious traders sharing real-time market insights and identifying opportunities you might have missed on your own.
Expert Pattern Recognition
– Join Andrew Pancholi as he deconstructs complex market data in real-time refining how you evaluate trading opportunities.
Strategic Trade Planning
– Receive detailed analysis of the highest-probability setups for the month ahead and elevate your professional trading plan.
This Platform is a
One-Time Yearly Subscription
Year 1 Subscription
$3,995
per year
Billed on a monthly basis. Auto-renews.
- ACCESS TO ALL INSTRUMENTS - FX Majors, Crosses, Crypto, Indexes, US Stocks, UK Stocks, Financials, Energies, Metals, Grains, Softs, Meats, etc.
- Access to Planner/Dashboard, Top 20 Correlations, All seasonal patterns, “What If?” and True Path
- 14-Day Money Back Guarantee – completely risk free
- Cancel anytime
Year 1 Subscription
$3,995 USD
for your first year
Subsequent Years: $199 USD/month (Savings of $1,607 USD)
- Smart Money Platform (formerly called the Master Traders Professional Platform)
- Monthly Power Sessions
- Training Course
- Bonus: Weekly Time Cycles on 6 Additional Instruments
The same knowledge professional traders deploy
The same knowledge professional traders deploy
This strategy generated a 34% return when we ran a hedge fund, outperforming the S&P by 48%.
While most traders catch the move too late, this platform positions you at the starting line. Enter the trade when the smart money does. Timing is everything, right?
Get the edge and see market moves others can’t.
There are no contracts or obligations. Only pure, actionable market data. Cancel at any time.
All you have to do is send an email to support@cyclesanalysis.com with the subject line “Reverse Trend” and let us know in writing you’d like to cancel.
Your questions answered
Master Traders Course & Smart Money Platform FAQ's
What Is This Smart Money Platform And How Does It Work?
It’s a powerful trading analytics platform that uses the Commodity Futures Trading Commission’s Commitment of Traders (COT) data to reveal what the “smart money” – major market players like commercial hedgers and large speculators – are doing in the markets. The system automatically sifts through the weekly COT reports and identifies high-potential trading opportunities, alerting you to which markets might be about to make a big move. In short, the platform tracks where the big players are placing their bets and breaks all that raw data down into clear, potentially actionable signals.
What Is COT Data, And Why Is It So Important For Trading?
The Commitment of Traders COT report is a weekly dataset showing how different groups of traders commercial hedgers, large speculators, small speculators, etc are positioned in various futures markets. This information is invaluable because commercial traders smart money often drive market trends, accounting for a majority of market activity. When these big players reach extreme positions for example, they’ve bought or sold much more than usual it often signals a coming trend reversal. By tapping into COT data, the platform lets you follow the smart money and anticipate major moves before they happen, giving you a critical edge in not only timing the markets but identifying instruments that are likely to move.
Who Is This Platform For? Do I Need To Be An Expert To Use It?
This platform is designed for both retail traders and seasoned professionals who want a competitive edge. You do not need to be a COT data expert – the interface presents insights in a user-friendly, at-a-glance dashboard with visual cues (like simple color-coded alerts) so you can instantly grasp what’s happening. In fact, it comes with a comprehensive Master Traders Course that teaches you how to read, use, and trade using the COT data signals step by step. So whether you’re an experienced trader or just serious about improving your trading, you’ll find the platform accessible. It’s essentially a professional-grade tool made easy for anyone who wants to trade smarter. We also hold a monthly Power Session during which we analyse the key signals.
How Does This Platform Increase My Confidence In Trade Decisions?
It boosts your confidence by grounding your decisions in hard data and insider-level insight. You’re not guessing – you’re seeing what the most influential market participants are doing and basing your trades on that real “smart money” activity. The platform even shows you how large the moves are (for both commercial and non-commercial traders), which helps confirm the strength of a signal. It also cross-checks these signals with other factors like seasonality, so you know if a potential move aligns with typical historical patterns or not. All of this means when you pull the trigger on a trade, you can be far more confident because you have multiple layers of evidence saying “yes, this is the right move” – from big-money trader positioning to timing cues – backing you up.
What Is The Master Traders Course, And Why Is It Included?
The Master Traders Course is an in-depth training program bundled with the platform to ensure you get the most out of these tools. It consists of short, focused modules (about 19 videos, usually under 10 minutes each) that teach you everything from how to read the COT data, to how to use the platform. In other words, it takes you by the hand and shows you how to become a “smart money” trader step by step. You can also see the seasonal profiles which give you an added advantage. On top of that, the course includes monthly live Power Sessions – essentially webinars or calls with the platform’s creator and other expert traders, where they discuss current market opportunities and answer your questions. The reason this course is included is to fast-track your success: even if you’ve never used COT data before, you’ll quickly learn the techniques and be able to trade with confidence using the platform’s insights.
What Support Is Available?
Every month, we record a Power Session analysing the latest CoT data together with potential set ups. All subscribers are invited to send CoT related questions in and these will be answered during the Power Session.
What Do I Get With My Subscription?
When you subscribe, you’re not just getting raw data – you’re getting a complete trading toolkit that helps you maximize your edge from day one. Here’s what’s included in our flagship package:
Professional CoT Platform Access: You gain full access to the CoT analytics platform itself, with all markets unlocked (forex, stocks, commodities, etc.) and weekly updates as new data comes in. This is the core engine that gives you the real-time smart money analysis each week.
The Master Traders Course: This is our on-demand training program (19 bite-sized video modules) that teaches you how to read, interpret, and trade using CoT data. It walks you through everything – from understanding the CoT report breakdown, to spotting the bullish/bearish signals, to executing trades based on those signals. Even if you’re new to CoT analysis, these short modules (most under 10 minutes) will quickly get you up to speed on professional techniques. The course ensures you can fully leverage the platform’s insights and trade with confidence.
Monthly Live “Power Session” Webinars: Every month you’ll join a live online session with our founder and master analyst, Andrew Pancholi (and occasionally other industry experts). In these Power Sessions, Andrew discusses the latest market opportunities, goes deep into the data from the platform, and answers subscriber questions in real-time. It’s like getting a personal mentoring session each month – you’ll gain experienced insight into what the CoT signals are suggesting for the month ahead, which setups look promising, and how to capitalize on them. These sessions keep you actively learning and give you fresh trade ideas on a regular basis.
PREMIUM BONUS Weekly Time-Cycle Forecasts: Receive proprietary weekly cycle turning point dates, exclusive to members. These forecasts, based on the same methodology behind the Market Timing Report, help you anticipate major market turns and fine-tune entries and exits. Combined with CoT positioning and seasonality, they form a powerful edge that many traders pay thousands for, while we include it to improve your decision and profit making potential.
How Much Does The Smart Money Platform Cost?
The Master Traders Course and Smart Money Platform is available as a single yearly subscription of $3,995 USD for the first year and then $199 USD per month for subsequent years. This represents a saving of $1,607 USD. The subscription includes the Smart Money Platform, the Monthly Power Sessions, The Training Course and the bonus weekly time cycles on a number of additional instruments. Once subscribed, you have access to a members area. If you wish to cancel your subscription, please contact support@cyclesanalysis.com.
What Markets Can I Analyze With This Platform?
You can analyze virtually any market that has a CoT report – and that covers a lot of ground. The platform includes data for all the major asset classes: stock indices, currencies (FX majors and minor crosses), commodities of all types (metals, energies, agriculturals, etc.), sovereign bonds, and even cryptocurrency futures. So whether you trade E-mini S&P futures, gold, WTI crude oil, corn, 10-year Treasury notes, or the Euro currency (to name just a few), you’ll find the CoT analytics for those markets. It’s all under one roof.
Importantly, even if you don’t trade futures directly – say you trade spot forex or equity ETFs – the CoT data is still highly relevant for you. That’s because futures markets often drive the pricing for other markets. For example, the spot FX rate for EUR/USD is influenced by the futures market for euro currency, and stock ETFs are affected by the index futures. The CoT report is essentially the only transparent record of what big traders are doing across these markets, which means it offers insight you can’t get from price charts alone. So by watching CoT data on, say, currency futures or stock index futures, you gain insight into the likely moves in forex pairs or stock markets you might actually trade. In short, no matter what your focus – stocks, forex, commodities, crypto – our platform has you covered, and it helps you see the bigger intermarket picture. You’ll never have to wonder if a market is being heavily accumulated or distributed by institutional players – you can see it directly and adjust your trades accordingly.
How Often Is The Data Updated, And How Quickly Can I Act On The Signals?
The CoT data is updated weekly, and our platform refreshes immediately when new data is released. The U.S. Commodity Futures Trading Commission publishes the official CoT report every Friday at 3:30 pm Eastern, reflecting positions as of that week’s Tuesday close. We pull in this data and update our charts and indicators right away, so typically by Friday evening (or Saturday morning, depending on your time zone) you’ll see the latest positions of traders on the platform. This means every week you get a fresh read on the market’s internal state – this allows you to stay well ahead of the trading game.
Because our platform presents the analysis in real-time once the data is in, you can act on signals immediately. For example, if by Friday’s data you see an extreme bullish CoT signal on a market, you could plan trades as early as Monday to take advantage. There’s no delay or lag in waiting for a monthly or quarterly report; it’s a weekly cycle of insights. In addition, the timeliness of the platform’s alerts means you’re often ahead of the typical indicators. You’re getting information within the same week that major players made their moves. That gives you the weekend to strategize and the ability to enter positions before the rest of the crowd catches on. In trading, information is power – and we ensure you get that information as fast as possible so you can strike while the iron is hot.
Links
Home
About Us
Track Record
Contact Us
Testimonials
Products
The Market Timing Report
The Market Timing Report Trading Course
The Master Traders Course and Smart Money Platform
Advanced Seasonality Platform
The Grain Timing Reports