The Complete Market Timing Guide
Ask any traditional financial advisor about market timing and you’ll likely get the same rehearsed answer:
“You can’t time the market — just buy and hold.”
It sounds comforting. It’s easy to say. And for decades, it has conveniently justified an industry built on collecting fees no matter what the market does.
But here’s the truth:
You can time the market — when you understand cycles.
Table of Contents
This guide is not about guessing highs or predicting crashes. It’s about understanding the natural timing mechanisms that repeat through financial markets, economics, human behaviour, seasonality, liquidity flows, and even space weather based rhythms.
These cycles shape the markets with clock-like regularity, influencing when markets expand, when they contract, and when they are vulnerable to big turning points.
Cycle-based market timing is not magic, fortune-telling, or gut instinct. It is:
- The systematic study of repeating financial rhythms
- The measurement of when probability shifts
- The anticipation of turning points
- The alignment of time and price
- The art of preparation rather than prediction
Markets Do Not Move In Straight Lines
They move in cycles.
These cycles have been documented for centuries. Economists, traders, mathematicians, and even ancient astronomers noticed repeating rhythms in everything from commodity prices to harvest yields to human psychology.
Modern cycle analysts — such as those behind the Market Timing Report — take this tradition much further.
They combine short-term cycles, intermediate cycles, long-wave economic cycles, sentiment rhythms, seasonality patterns, and historical repeating structures into a single, powerful timing framework.
The goal isn’t perfection.
The goal is preparation and probability.
This guide will take you through everything you need to understand about cycle-based market timing:
- How and why it works
- The science behind it
- Real-world examples of major turning points
- Timing tools the professionals use
- Strategies you can apply immediately
We'll also investigate how the Market Timing Report helps investors act before the crowd.
Whether you're a long-term investor wanting better entries, a trader seeking high-probability windows, or simply someone who wants to understand why markets behave the way they do, this is your comprehensive guide.
By the end of this guide, you’ll see markets differently — not as chaotic, random forces, but as structured, rhythmic systems shaped by cycles that have repeated for generations.
Let’s begin where all great timing systems begin:
With a definition that actually makes sense.
The Market Timing Report Philosophy
Instead of guessing, why not use cycle clusters, histograms, and turning point dates that help you anticipate major changes in market direction. Don't be part of the the crowd that reacts late, fears bottoms, chases tops, and endlessly wonders why the market “suddenly” turned!

What Is Market Timing? (The Real Definition)
Market timing is the process of using multiple data points to narrow down the moment when a market is likely to change direction, and to position yourself to take advantage of the move, either up or down.
If you search “market timing” online, you’ll get thousands of articles telling you the same thing:
“Market timing doesn’t work.”
“It’s impossible to know when the market will move.”
“Just buy and hold and stop trying to be clever.”
Ironically, many of these articles are written by banks, fund managers, passive ETF providers and even financial advisors who get paid regardless of market direction.
In other words: the exact people who benefit when you don’t manage risk, don’t time entries, and don’t question the narrative.
Let's see what market timing is and what it's not:
- Understanding market cycles
- Anticipating turning points
- Aligning price with time
- Preparing for high-probability windows
- Reducing risk when cycles indicate vulnerability
- Acting when price confirms timing
- Guessing
- Reacting to news
- Predicting exact highs or lows
- Emotional decision-making
- Jumping in and out constantly
- Trading based on fear or excitement
Cycle-based analysts don’t try to predict the future with surgical precision.
Instead, they identify windows of elevated probability — times when cycles suggest the market is likely to peak, bottom, trend, stall, or reverse.
True market timing is a discipline — not a gamble. It's a multi-discplinary approach based on mathematics, historical market patterns, human psychology, liquidity flows, economic cycles, seasonality and repeating rhythms in nature and behaviour.
If the mainstream definition insists that timing means predicting the exact top on the exact day to the exact minute… then sure, “market timing” doesn’t work.
But we’re not doing that. We’re identifying windows, clusters, cycle peaks, cycle troughs and high and low risk zones.
This is preparation, not prediction.
The Foundations of Cycle Analysis
To understand market timing, you must first understand cycles — because cycles are the backbone of all timing models, from short-term trading to long-term investment strategy.
Cycles are not theoretical. They are not abstract. They are not “nice ideas” that sometimes show up.
Cycles are everywhere.
They govern:
- Economic expansions and recessions
- Corporate earnings patterns
- Investment flows
- The behaviour of institutions
- Human psychology and the natural world
If you strip away the news, strip away the noise, strip away the endless analyst opinions… what remains is the rhythmic pattern of markets rising, falling, consolidating, expanding, contracting, and repeating.
Cycle analysis is simply the study of that rhythm.
Why Markets Form Cycles
There are several underlying forces that naturally create cycles in financial markets.
These forces repeat — not because history magically copies itself, but because the drivers behind market behaviour remain consistent over time.
Here are the core forces:
Human Behaviour Is Cyclical
Fear and greed do not behave randomly. They oscillate.
Investors become optimistic together, become pessimistic together, chase highs together and panic together.
They also capitulate together and this creates predictable waves of collective emotion.
When millions of people respond to the same stimuli the same way, a pattern forms — and that pattern repeats through history.
Institutional Liquidity Flows Are Cyclical
Big money moves in predictable stages:
These are accumulation, markup, distribution and markdown.
These aren’t random phases. They follow repeating liquidity cycles.
When liquidity dries up, markets weaken. When liquidity expands, markets rise.
Liquidity cycles have been measured for decades, and they make excellent timing tools.
Economic Activity Is Cyclical
All economies move through expansion, peak, contraction and trough.
This 4-stage process generates waves in employment, production, credit, consumption and inflation.
Economic cycles influence stock market cycles — often with remarkable precision.
Seasonality Is Cyclical
Markets have well-documented seasonal patterns:
Stocks often struggle in mid-year, gold has strong seasonal impulses, energy and commodities have weather-driven patterns and retail stocks follow holiday cycles.
Seasonality adds a repeating rhythm within the wider cycles.
Time Cycles In Markets Repeat Naturally
Certain timing structures — such as 20-day cycles, 30-week cycles, 4-year cycles, etc. — repeat because they emerge organically from crowd behaviour, political election timing and macroeconomic patterns.
This is why cycle analysts often refer to dominant cycles, harmonic cycles and nested cycles.
Each cycle layers on top of the others, creating periods of amplification and suppression.
Price Does Not Travel In Straight Lines
All markets oscillate:
- impulse → correction
- rally → pullback
- trend → consolidation
- This is not noise — it’s structure
- And structure implies timing
Cycle Interaction: The Real Secret Behind Major Turning Points
A single cycle can move the market. But multiple cycles turning at once can create powerful reversals, major trend shifts, volatility explosions, market bottoms and blow-off tops.
Cycle analysts call these cluster points.
The Market Timing Report visualises cycle clusters using histograms, showing windows where multiple cycles converge into a high-probability turning point.
This approach simplifies complexity, distils dozens of cycles into one clear signal and gives investors a roadmap of upcoming risk windows.
This is one of the great advantages of cycle analysis — it transforms complexity into clarity.
Cycles Don’t Predict the Market — They Reveal Its Structure.
Cycle analysis doesn’t claim that time alone determines every move. Instead, it reveals the environment in which price is likely to behave a certain way.
Time tells you when the market is vulnerable. Price tells you how the market is responding.
Combined, they form one of the most powerful frameworks in modern investing.
The Evidence For Cycles (History, Data & Real-World Proof)
If cycles were just a theory, they’d be interesting… but not useful. But the truth is far more compelling.
Cycles show up everywhere — in every market, in every era, across every asset class.
Economists have documented cycles for over 200 years. Traders have used them for centuries. Institutions rely on them today.
Let’s look at the evidence.
Economic Cycles: The Four Stage Rhythm of Expansion and Contraction
Virtually every economics textbook describes the business cycle:
Expansion, peak, contraction and trough
This cycle typically lasts 4 to 10 years and influences:
Corporate earnings, employment, interest rates, consumer spending and asset prices.
When the economy expands, markets tend to rise. When it contracts, markets become vulnerable.
This alone proves that markets follow time-based patterns.
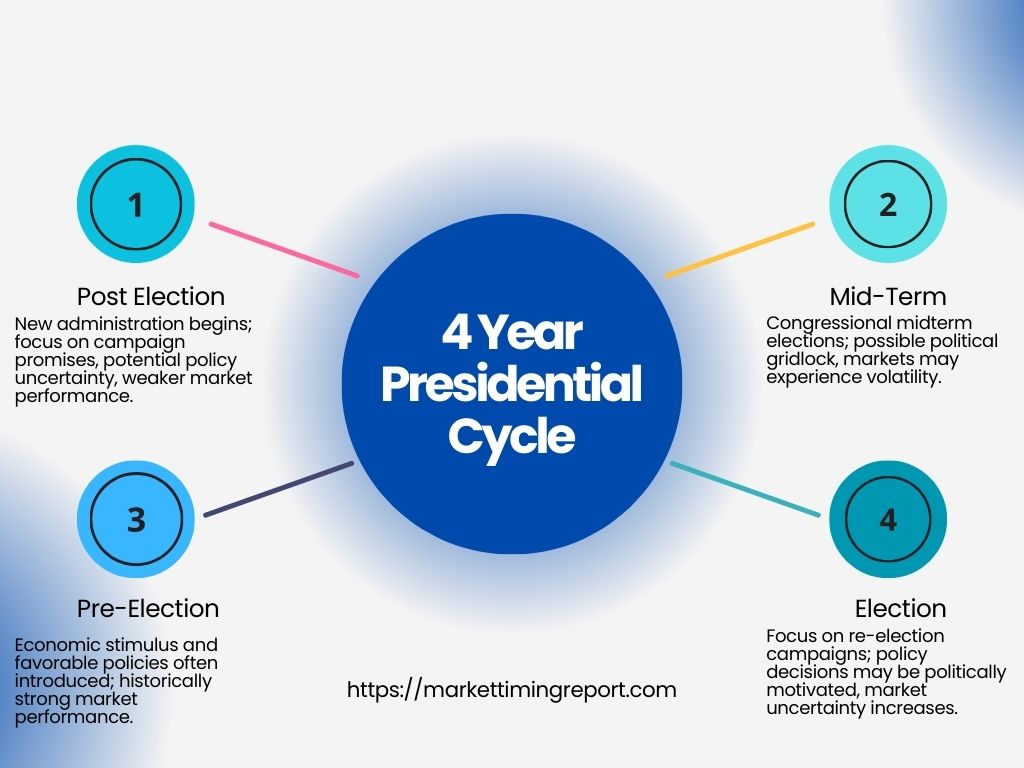
The Presidential Cycle: The Four Year Stock Market Rhythm
For more than 70 years, U.S. markets have followed a repeating pattern based on the presidential term:
Year 1: weaker performance, Year 2: often volatile, Year 3: one of the strongest years historically, Year 4: steady into elections.
It doesn’t matter who the President is — the pattern holds with remarkable consistency.
Why?
Because political incentives — spending, stimulus, policy tone — follow a timed structure.
The 10-Year Decennial Cycle
Going back over a century, markets have shown a distinctive rhythm based on the last digit of the calendar year:
Years ending in “5” often produce strong rallies.
Years ending in “0” often produce weakness.
“7” years frequently show corrections.
“9” years often show tops or transitions.
This sounds mystical, but it’s just statistical pattern recognition — the market tends to move in multi-year waves.
The 18-Year Real Estate And Credit Cycle
Economist Homer Hoyt documented the 18-year property cycle nearly a century ago.
Hoyt wasn' t the only one and there have been a number of past and present cycles and economic analysts who have documented the same repeating pattern.
It remains astonishingly accurate today.
It influences:
- Credit availability
- Construction
- Bank lending
- Economic growth
- Speculative bubbles
Stock markets respond powerfully to these long-wave cycles, especially during credit expansions and contractions.
Seasonality: One of the Most Predictable Market Rhythms
Seasonality is one of the simplest forms of cycle analysis. Across long periods, markets show consistent seasonal patterns:
Stocks: Weak mid-year, strong late-year.
Gold: Often rallies from July–February.
Oil: Moves with weather-driven demand.
Agriculture: Follows planting and harvest cycles.
Retail stocks: Spike around holidays.
Seasonality works because human behaviour and consumer patterns follow annual rhythms.
Other Cycles And Their Effects On Markets
Volatility Cycles
VIX (volatility) moves in cycles too.
Periods of:
calm → lead to leverage buildup
leverage buildup → leads to fragility
fragility → leads to volatility spikes
spikes → lead to rebalancing and calm
These cycles repeat endlessly, often in multi-week or multi-month rhythms.
Market Crashes
The biggest market collapses in history have uncanny timing similarities:
1929, 1987, 2000, 2008, 2020
No two crashes happen for the same reason but they happen during similar cycle positions:
Over-leveraged markets, extreme optimism, weakening liquidity, extended cycle peaks and converging time windows.
The cause changes. The cycle doesn’t.
Corporate Earnings
Companies don’t earn the same amount year-round. Revenue follows:
product cycles
retail cycles
demand cycles
seasonal cycles
Because profits move in cycles, stock prices naturally reflect those cycles.
Human Psychology
Crowds move in predictable emotional arcs:
Optimism, excitement, euphoria, anxiety, fear, panic, capitulation, disbelief and recovery.
These emotional waves create:
Peaks at extremes, troughs at capitulations, reversals when sentiment becomes unanimous.
And they show up on charts as repeating cycle structures.
General market Behavior
Markets are not random, markets are not chaotic, markets are not unpredictable.
They are cyclical.
When you understand cycles, you begin to understand the market’s internal clock — the clock that beats beneath price movement, beneath news, beneath sentiment.
And it is this clock that cycle-based market timing seeks to measure.
How Professional Market Timing Works (Deep-Dive)
Most investors look at “market timing” and imagine a dark room, 18 monitors, a stressed-out trader pounding espresso shots and shouting at candlesticks.
Let’s erase that picture completely.
You can begin using a cycles-based market timing approach calmly, systematically, and without needing professional-level software or a hedge fund desk. What you do need are:
A structured framework;
A clear way to interpret cycles;
A repeatable process;
A mindset that values probability over prediction;
Below, we’ll walk through exactly how to start implementing market timing in your investing—step by step.
Step 1: Identify the Dominant Cycle(s) of the Market You’re Trading
Every market—stocks, gold, crypto, currencies—moves through multiple overlapping cycles.
The three you’ll use most often are:
1. Short-Term Cycles (1–30 days)
Used for: Swing trading, identifying good entries and exits, understanding when momentum is exhausting.
These cycles help you avoid buying at local peaks or selling prematurely.
2. Intermediate Cycles (1–6 months)
Used for: Medium-term positioning, capturing large tradable swings, avoiding major corrections.
This is where many Market Timing Report subscribers get the biggest value because intermediate cycles often provide high-probability turning points.
3. Long-Term Cycles (1–20+ years)
Used for: Macro trend direction, identifying major bull/bear market transitions, large portfolio allocation shifts.
Long-term cycles tell you whether you should primarily be:
Buying dips, or selling rallies.
You don’t need to model every cycle, buy you can use cycles as an overlay to your investing process.
Step 2: Plot Known or Probable Turning Points
Turning points act like anchors in your timing framework. The more signals align, the higher the probability of a major turn.
They don’t tell you the magnitude of a move—but they tell you when markets are most vulnerable to reversing.
What to look for:
- A cluster of timing indicators pointing to the same date
- Confluence from different cycle lengths
- Similar dates appearing across multiple markets
- Historical repetition on the same calendar window
- Reinforcing astronomical/seasonality signals
- Histogram spikes (as used by the Market Timing Report)
Step 3: Combine the Time Window With Technical Structure
Cycles give you the when. Technical structure gives you the where. Together, they give you the why.
Technical tools to combine with timing:
Support and resistance, trend channels, fibonacci retracements, fibonacci time extensions, RSI (Relative Strength Index) or other momentum exhaustion indicators such as:
Volume/participation shifts, candlestick exhaustion signals and divergences.
What you’re looking for is simple:
A technical pattern approaching exhaustion inside a cycle turning window.
A turn date with no technical exhaustion → low probability
A technical exhaustion but no turn date → low probability
A technical exhaustion on a turn date → high probability
One of the reasons why the Market Timing Report was created was to narrow the focus to the most important days, so you don’t burn energy analysing noise.
Step 4: Build A Simple Rules-Based Playbook
Your market timing playbook does not need to be complex. In fact, simple is better. Set up a template like the example below.
Your Market Timing Playbook Template
1. BEFORE THE TURN WINDOW
Identify the upcoming turn dates, note the market’s current trend direction, mark key price levels that would confirm a turn and then prepare scenarios (bullish, bearish, neutral).
2. DURING THE TURN WINDOW
Seek reversal-type price behaviour and watch for range breaks, false breakouts, and long-wick candles. Confirm with momentum divergence and then look for exhaustion patterns (e.g., 5th wave, parabolic spikes).
3. AFTER CONFIRMATION
Enter positions only when structure confirms the turn. Set risk parameters based on cycle magnitude. Use stop-losses below/above exhaustion points.
Scale into positions rather than going all-in instantly
4. EXIT STRATEGY
Use next cycle window as a likely exit. Trail stops using swing highs/lows or ATR. Exit on signs of cycle exhaustion even if early and take partial profits on momentum bursts.
This keeps you consistent, calm, and unemotional.
Step 5: Track Your Own Cycle Performance Data
You become dramatically better at market timing the moment you start keeping data. You must know where you are before you know where you're going (or where the market's been) so tracking data is vital.
Track data such as:
Turning point dates, actual highs/lows, average error (lead or lag), magnitude of gains after each turn and whether the move aligned with the long-term trend.
You can also track data such as what confirmation signals worked best.
After just 90 days of tracking, most traders see patterns emerge:
Certain markets respect cycles more, certain turn windows are “stronger”, and certain confirmation tools work better.
Over time, cycle analysts often discover that stock indices are among the most reliable, while natural resources like gold are highly cyclical.
Crypto cycles tend to run shorter and more volatile, while currency pairs require more confirmation.
However you do it, tracking gives you a personal timing system that compounds in value.
Step 6: Risk Management (Probably The Most Important Timing Tool)
Most investors crave more profit. But professionals crave less risk.
Market timing is primarily a risk management/risk reduction framework.
It helps you avoid:
Buying at peak euphoria, being trapped in a correction, chasing tops and selling bottoms out of fear.
If all you did was avoid buying inside major cycle tops, you would outperform most investors.
And if you also focus your buying inside cycle lows, you dramatically increase your long-term compounding.
This is why market timing fits beautifully into:
1. Stock accumulation plans
2. Portfolio rebalancing
3. Active trading
4. Options strategies
5. Long-term wealth building
Market timing is not fortune-telling. It’s not mystical. It’s not prediction.
It is…
A probability framework grounded in recurring patterns of human behaviour. To be successful, you must adopt the mindset professionals use:
1. You’re not here to predict. You’re here to prepare.
Cycles tell you when to pay attention—not what will happen.
2. The goal is consistency, not perfection.
You won’t catch every turn. You just need the big ones.
3. Timing reduces stress and emotional decision-making.
You always know what dates matter. You never feel lost.
4. No turn date stands alone.
You always combine timing with structure for confirmation.
5. Market timing works best when you trust the process.
The more you use it, the more the patterns reveal themselves.
Tools of Cycle-Based Market Timing
Once you understand how professional market timing works the next logical question is:
What tools actually make this possible?
Cycle-based market timing isn’t built on gut feel or chart patterns alone. It relies on a specific set of tools designed to measure time, not just price. This is a critical distinction — and one that separates genuine cycle analysts from traditional technical traders.
Let’s break down the core tools used in cycle-based market timing, including those that underpin the Market Timing Report approach.
Time-Based Cycle Models (The Core Tool)
At the heart of cycle analysis are time cycles — measured intervals between significant highs and lows. These models track: The length of previous market swings Repeating intervals between turning points Harmonic relationships (e.g. half-cycles, double-cycles) Consistency across decades of data Rather than asking “Is the market overbought?”, cycle analysts ask: “Is the market due — in time — for a turn?” This shift in thinking is fundamental. Price can remain overbought or oversold far longer than most people expect. Time, however, exerts pressure relentlessly.
Cycle Clustering & Confluence Analysis
One cycle alone is rarely enough. Professional timing focuses on cycle clusters — moments when multiple independent cycles point to the same time window. These clusters dramatically increase probability. Examples of cycles that may cluster together: Short-term trading cycles Intermediate market cycles Seasonal cycles Political or fiscal cycles Macro-economic cycles space weather cycles When several of these converge on the same dates, the market becomes vulnerable to a turning point. This is a cornerstone of the Market Timing Report methodology.
Proprietary Histograms
One of the defining tools of the Market Timing Report is its use of cycle histograms. Rather than forcing readers to interpret dozens of cycles individually, MTR compresses them into a single visual output that shows: Where cycle pressure is building Which dates matter most The relative strength of each timing window When markets are statistically vulnerable This matters because cycle analysis can become overwhelming without simplification. Histograms solve that problem by answering one core question: “When should I pay attention?” They do not predict price direction. They highlight timing importance.
Seasonality Models
Seasonality is one of the most robust and widely accepted forms of cycle analysis. Markets exhibit consistent seasonal tendencies due to: Institutional reporting periods Tax cycles Human behavioural rhythms Business and earnings calendars Weather-related demand patterns Examples include: Equity market strength late in the year Mid-year weakness in many indices Gold’s recurring mid-year lows Commodity demand cycles Seasonality doesn’t replace cycle analysis — it reinforces it. When seasonal tendencies align with other cycle tools, turning-point probability increases significantly.
Technical Analysis as Confirmation (Not Prediction)
Cycle-based market timing does not replace technical analysis — it reframes its role. In a timing framework: Cycles answer when Technical analysis confirms if and how Common confirmation tools include: Support and resistance Trend channels Momentum divergence Volume exhaustion Breakout or breakdown structures The Market Timing Report consistently emphasises this discipline: Never trade time alone. Let price confirm the timing window. This prevents premature entries and false signals.
Sentiment & Behavioural Indicators
Sentiment acts as a powerful validating tool for cycles. Markets often peak when optimism is extreme — and bottom when fear is universal. Common sentiment tools include: Investor sentiment surveys Volatility indices Put/call ratios Media tone extremes Positioning data When extreme sentiment appears inside a cycle turn window, the odds of a reversal increase sharply. This is where behavioural finance and cycle analysis naturally intersect.
Types of Cycles in Financial Markets
Not all cycles are created equal.
One of the biggest misunderstandings about market timing is the belief that there is one dominant cycle driving prices.
In reality, financial markets are influenced by multiple cycles operating simultaneously across different timeframes.
Professional market timing is about understanding which cycles matter most, when they matter, and how they interact.
This section breaks down the major categories of cycles used in cycle-based investing and trading.
Short-Term Trading Cycles
Short-term cycles typically range from a few days to several weeks and are most relevant to active traders.
These cycles are driven by:
Liquidity fluctuations, institutional order execution, options expiration, news digestion and human behavioural rhythms.
Common examples include:
Weekly cycles, 7–10 day swing cycles, and options expiry cycles.
Short-term cycles help traders anticipate:
When momentum is likely to stall, when short-term exhaustion may occur or when volatility is likely to expand.
While these cycles don’t determine major trends, they provide tactical timing precision inside broader market moves.
Intermediate Cycles (The Investor’s Sweet Spot)
Intermediate cycles — generally ranging from one to six months — are where cycle analysis becomes especially powerful for investors.
These cycles often align with:
Quarterly fund rebalancing, earnings seasons, macro data cycles and seasonal tendencies.
Examples of intermediate cycles include:
The 30-week cycle, 90-day institutional cycles and seasonal market rhythms.
Intermediate cycles tend to define:
Medium-term highs and lows, multi-week corrections and tradable rallies within larger trends.
Traders and investors like to use this timeframe because it balances actionability with reliability.
Long-Term Market Cycles
Long-term cycles span many years and shape the structure of bull and bear markets.
These cycles are influenced by:
Credit expansion and contraction, economic growth phases, political and fiscal cycles and demographic trends.
Notable long-term cycles include:
The 4-year presidential cycle, 18.6 year business/economic cycles and credit cycles, 30, 45, 90 and 100 year cycles.
Long-term cycles are not about precise entry timing. Instead, they help investors to frame risk correctly. This helps avoid overexposure at major peaks and recognises long-term opportunities at deep market lows.
Understanding these cycles prevents emotional decision-making during extreme market environments.
Secular Cycles (Bull and Bear Eras)
Secular cycles define multi-decade periods where markets either trend broadly higher or move sideways with high volatility.
Characteristics include:
- Secular bull markets: strong innovation, rising productivity, expanding valuations
- Secular bear markets: stagnation, volatility, valuation compression
- Buy-and-hold works brilliantly in some decades
- The same strategy underperforms badly in others
Cycle-aware investors adapt their strategy depending on where they are in the secular cycle — a core principle of intelligent market timing.
Event-Driven And Cross-Market Cycles
Some cycles are tied to recurring events, rather than pure time intervals.
Examples include:
Election cycles, central bank policy cycles, budget cycles and regulatory and geopolitical cycles.
Markets often front-run these events, creating predictable timing pressure.
Cycle-based analysts monitor these rhythms not for headlines — but for repetition.
There are also situations where markets influence each other and cycles can propagate across instrument types. For example:
Equities, bonds, commodities, currencies and most recently crypto assets.
For example:
Bond cycle turns often precede equity turns. Commodity cycle peaks can signal inflationary shifts and currency cycles affect global equity flows.
Financial markets are influenced by many cycles, seasonal patterns, bull and bear trends and event and cross-market situations
Understanding these layers allows investors to see the market in time, not just in price.
This multi-cycle framework is essential to the Market Timing Report approach — and a major reason its turning-point analysis consistently outperforms reactive strategies.
The Market Timing Report Philosophy
Instead of guessing, why not use cycle clusters, histograms, and turning point dates that help you anticipate major changes in market direction. Don't be part of the the crowd that reacts late, fears bottoms, chases tops, and endlessly wonders why the market “suddenly” turned!
Market Timing Strategies (Detailed)
By now, we’ve covered what market timing is, why cycles matter, and the tools professionals use to identify high-probability turning points.
The natural next step is application.
This section outlines practical market timing strategies built around cycle analysis — not prediction, not day-trading hype, and not hindsight narratives. These are structured, repeatable approaches designed to improve decision-making for both investors and active traders.
Importantly, none of these strategies rely on guessing market direction in advance. They are built around time awareness and probability management.
The Cycle Window Strategy (Core Strategy)
This is the foundational strategy used by most cycle-based investors.
Concept:
Identify a cycle-defined window of vulnerability and wait for price confirmation.
How it works:
A cycle cluster highlights an upcoming turning-point window.
The investor does nothing until price reaches a logical technical level.
Action is taken only if price confirms the cycle window.
This strategy avoids premature entries and removes emotional decision-making.
Why it works:
Markets can ignore price signals — but they rarely ignore time indefinitely.
This approach aligns perfectly with the Market Timing Report’s emphasis on “pay attention here”, not “buy now” or “sell now.”
Risk-Reduction Timing Strategy (Investors)
Market timing is not only about entering positions — it is just as powerful for risk management.
Long-term investors use cycle analysis to:
Reduce exposure near major cycle highs, avoid adding capital late in extended cycles, increase cash during high-risk time windows and re-deploy capital near cycle lows.
Even small timing improvements can produce outsized long-term benefits.
Avoiding just a handful of major drawdowns dramatically improves portfolio outcomes.
This strategy appeals to investors who don’t want to trade frequently but still want to respect market cycles.
Accumulation Strategy at Cycle Lows
Cycle lows often occur when sentiment is poor, headlines are negative, and confidence is low.
This strategy focuses on:
Identifying long-term or intermediate cycle lows, scaling into positions over a timing window and avoiding all-in, all-out behaviour.
Rather than attempting to “pick the exact bottom,” investors accumulate during high-probability zones.
Cycle timing provides the confidence to act when emotions say “wait.”
Trend Participation Strategy (Cycle-Aligned Trends)
Cycles don’t fight trends — they structure them.
This strategy involves:
Identifying the dominant trend, using cycles to time pullbacks within that trend and avoiding counter-trend trades unless major cycle turns align.
Cycle timing helps investors avoid the classic mistake of selling too early in strong trends — or buying too early in weak ones.
This is particularly effective during sustained bull markets.
Breakout Timing Strategy
Major breakouts often occur near cycle turning points — especially when markets have been consolidating.
This strategy focuses on:
Monitoring long consolidation ranges, identifying upcoming cycle pressure windows and entering only on confirmed breakouts.
Cycles act as the ignition timing, while price action determines direction.
This reduces false breakouts and improves reward-to-risk ratios.
Time-Based Stop Strategy
Most traders use price-based stops.
Cycle-based traders also use time-based stops.
Rule:
If the expected move does not occur within the timing window, exit.
This approach:
Prevents capital stagnation, avoids emotional attachment and keeps trades aligned with cycle logic.
Time stops are one of the most under-used — yet effective — risk management tools in market timing.
Multi-Asset Timing Strategy
Cycles often align across markets.
This strategy involves:
Monitoring timing clusters across asset classes, shifting exposure rather than exiting entirely, and rotating capital based on relative cycle positioning.
For example:
Reducing equities while increasing defensive assets.
Increasing commodities near inflationary cycle turns.
Adjusting currency exposure based on global cycles.
What Market Timing Strategies Are Not
To be clear, cycle-based strategies are not:
Day-trading systems, high-frequency algorithms, constant buy/sell signalling services or emotional “top calling” exercises.
They are structured decision frameworks designed to stack probability over time.
Effective market timing strategies share common traits:
They respect time before price.
They wait for confirmation.
They manage risk proactively.
They avoid constant activity.
They are repeatable and disciplined.
This strategic discipline is the reason cycles analysis is used by investors who value clarity over noise.
Why Most People Fail at Market Timing
Market timing has a reputation problem.
Not because it doesn’t work — but because most people approach it incorrectly.
Ironically, the majority of failures attributed to market timing have very little to do with timing itself. They stem from behavioural errors, unrealistic expectations, and poor execution.
Understanding why people fail is essential if you want to avoid becoming one of them.
They Try to Predict Price, Not Time
The most common mistake is confusing market timing with market prediction.
Many people attempt to:
Call exact tops and bottoms, forecast precise price targets and predict news events before they occur.
Cycle-based market timing does none of this.
It focuses on windows of vulnerability, not precise outcomes.
When people try to force certainty onto an inherently probabilistic process, disappointment is inevitable.
They Expect to Be Right All the Time
Another fatal error is the belief that good timing means high win rates. Professional market timers don’t aim to be right on every trade. They aim to be right when it matters most.
Timing is about:
Avoiding large losses, participating in major moves and improving average decision quality.
Even modest improvements in timing can lead to dramatic long-term results. Expecting perfection guarantees frustration.
They Act Too Early — or Too Late
Cycles create windows, not moments. Many failures occur because investors:
Enter before price confirmation of trend change, exit before the cycle window completes or lose patience during consolidation.
Timing without confirmation leads to premature decisions. Confirmation without timing leads to late decisions.
Market timing requires both.
They Overtrade
Knowing when markets are likely to turn does not mean you must always trade. In fact, one of the greatest advantages of cycle analysis is knowing when not to act.
Overtrading occurs when investors:
Feel pressure to “do something”, confuse activity with productivity or trade outside meaningful timing windows.
Most losses occur in the dead zones between cycles, not at turning points.
They Ignore Risk Management
Timing improves probability — it does not eliminate risk.
Failures often result from:
Oversized positions, no exit plan, emotional attachment to trades and refusing to accept invalidation.
Cycle-based traders respect risk because timing windows are finite.
If the move doesn’t happen when it should, they step aside.
They Let Emotion Or Too Many Signals Override Structure
Ironically, many people adopt timing systems but abandon them when emotions peak.
They hesitate at cycle lows due to fear. They chase at cycle highs due to excitement.
Without discipline, timing tools become irrelevant. This is why the Market Timing Report emphasises structure over opinion.
More information does not equal better decisions. Many traders sabotage themselves by:
Tracking dozens of indicators, mixing conflicting systems, or jumping between methodologies.
Cycle analysis works best when it is simple, consistent, and repeatable.
Complexity creates hesitation — hesitation destroys timing.
Market Timing Methodologies Keep You In The Game
Timing is a long-term edge. It reveals itself over multiple cycles, not a handful of trades.
Many people quit after:
One mistimed entry, one missed move, or one emotionally uncomfortable decision.
Ironically, these experiences often occur right before timing skills start to pay off.
Most people fail at market timing because they:
Confuse timing with prediction, expect certainty, act without confirmation, overtrade, ignore risk, let emotion dominate, or abandon structure.
Market timing doesn’t fail people — people fail market timing.
Market Timing Case Studies: Historical Market Turning Points
1990 World Recession
2000 Dot Com Bubble
The 2007–2009 Global Financial Crisis
The 2020 Pandemic Crash
What These Case Studies Have in Common
Across all these examples, several themes repeat:
Major turns occur near cycle convergence and emotional narratives peak near turning points. News acts as a trigger, not a cause and timing windows precede price confirmation.
These patterns are not coincidences — they are structural features of financial markets.
The examples above represent recent cycle events however there are many more examples going back hundreds of years.
Events such as:
The 144 year cycle including the 1720 South Sea Bubble, the 1864 American Civil War and the 2008 Commodity Boom.
The 72 year cycle which includes the 1857 Panic, the 1929 Stock Market Crash and the 2000-2001 Dot Com bubble.
And…
The 100 year cycle with events such as the 1807 Embargo Act Crisis, the 1907 Rich Man's Panic and the 2007 Global Financial Crisis.
There are cycles everywhere and once found, they become excellent forecasting and planning tools.
An Action Plan for Investors
Understanding market timing is valuable. Applying it consistently is where the real edge emerges.
In this section we look to create a clear, repeatable action plan that investors can realistically follow — without overtrading, overthinking, or abandoning their existing strategy.
This is not a trading system.
It’s a decision framework.
Accept That Timing Is About Probability, Not Prediction
Before anything else, reset expectations. Market timing does not mean:
Picking exact tops and bottoms, being right every time and avoiding all losses.
It means improving the quality of decisions by acting when the odds are better than average. This mindset shift is non-negotiable.
Identify the Markets That Matter to You
Do not try to time everything. Choose a focused universe, such as:
A major equity index (S&P 500, ASX 200, Nasdaq), one or two commodities or a core portfolio plus one tactical asset.
Market timing works best when attention is concentrated, not scattered.
Track Major Cycle Windows, Not Daily Noise
Cycle-based investors think in windows, not headlines.
Your job is not to react daily — it’s to know when markets are entering periods of elevated importance. This is where the Market Timing Report can play a critical role by:
Highlighting upcoming turning-point windows, filtering irrelevant dates and reducing information overload
Between windows, patience is a position.
Use Price Action for Confirmation
Timing tells you when to pay attention. Price tells you what to do. Before acting, look for:
Support or resistance interaction, momentum shifts, breakouts or breakdowns and failed moves (false breakouts often matter most).
Never trade time alone.
Adjust Exposure — Don’t Swing From Extreme to Extreme
Market timing does not require binary decisions. Instead of all-in or all-out thinking:
Scale exposure up or down, adjust position sizing, increase cash temporarily and rotate between assets.
Small adjustments, made at the right time, compound powerfully over years.
Respect Time-Based Invalidation
If a move doesn’t occur within the expected timing window, reassess. This rule alone can:
Prevent capital stagnation, reduce emotional attachment. improve discipline and keep you aligned with cycles.
Time is information. Use it.
Review Decisions by Process, Not Outcome
Markets are noisy. Judge success by asking:
Did I act during a valid timing window?
Did I wait for confirmation?
Did I manage risk appropriately?
Good process produces good outcomes over time — even if individual decisions don’t always work.
Stay Consistent Across Multiple Cycles
Market timing is a long-term edge. Its power emerges over:
Multiple market environments, bull and bear phases and volatility regimes.
Consistency matters more than brilliance.
The Ultimate Market Timing Guide Conclusion
Market timing has been misunderstood for decades. Not because it doesn’t work — but because it has been framed incorrectly.
True market timing is not about prediction or about calling tops and it’s not about reacting to headlines.
It’s about understanding cycles.
Cycles of capital, cycles of behaviour, cycles of fear and greed, cycles of expansion and contraction.
Markets move in time — whether investors acknowledge it or not.
By focusing on turning points instead of targets, probability instead of certainty, and discipline instead of emotion, cycle-based market timing offers investors something increasingly rare:
Clarity.
If You Want To:
Stop reacting to market noise
Understand when markets are most likely to change
Improve risk management without constant trading
Invest with structure, patience, and confidence
Links
Home
About Us
Track Record
Contact Us
Testimonials
Products
The Market Timing Report
The Market Timing Report Trading Course
The Master Traders Course and Smart Money Platform
Advanced Seasonality Platform
The Grain Timing Reports